7-day free trial · No card needed

Stock scores without the black box.

Rank about 3,000 US stocks with 9 scoring models, open any score to see the figures behind it, and test your model on up to 20 years of market history.

No card needed. $20 a month after the trial. Cancel any time. Already have an account? Sign in

See Stock Meadow in 90 seconds

The end of the Stock Meadow video: the Stock Meadow name, the line Every score explained, a Try it free for 7 days button and stockmeadow.com.

Try it without signing up

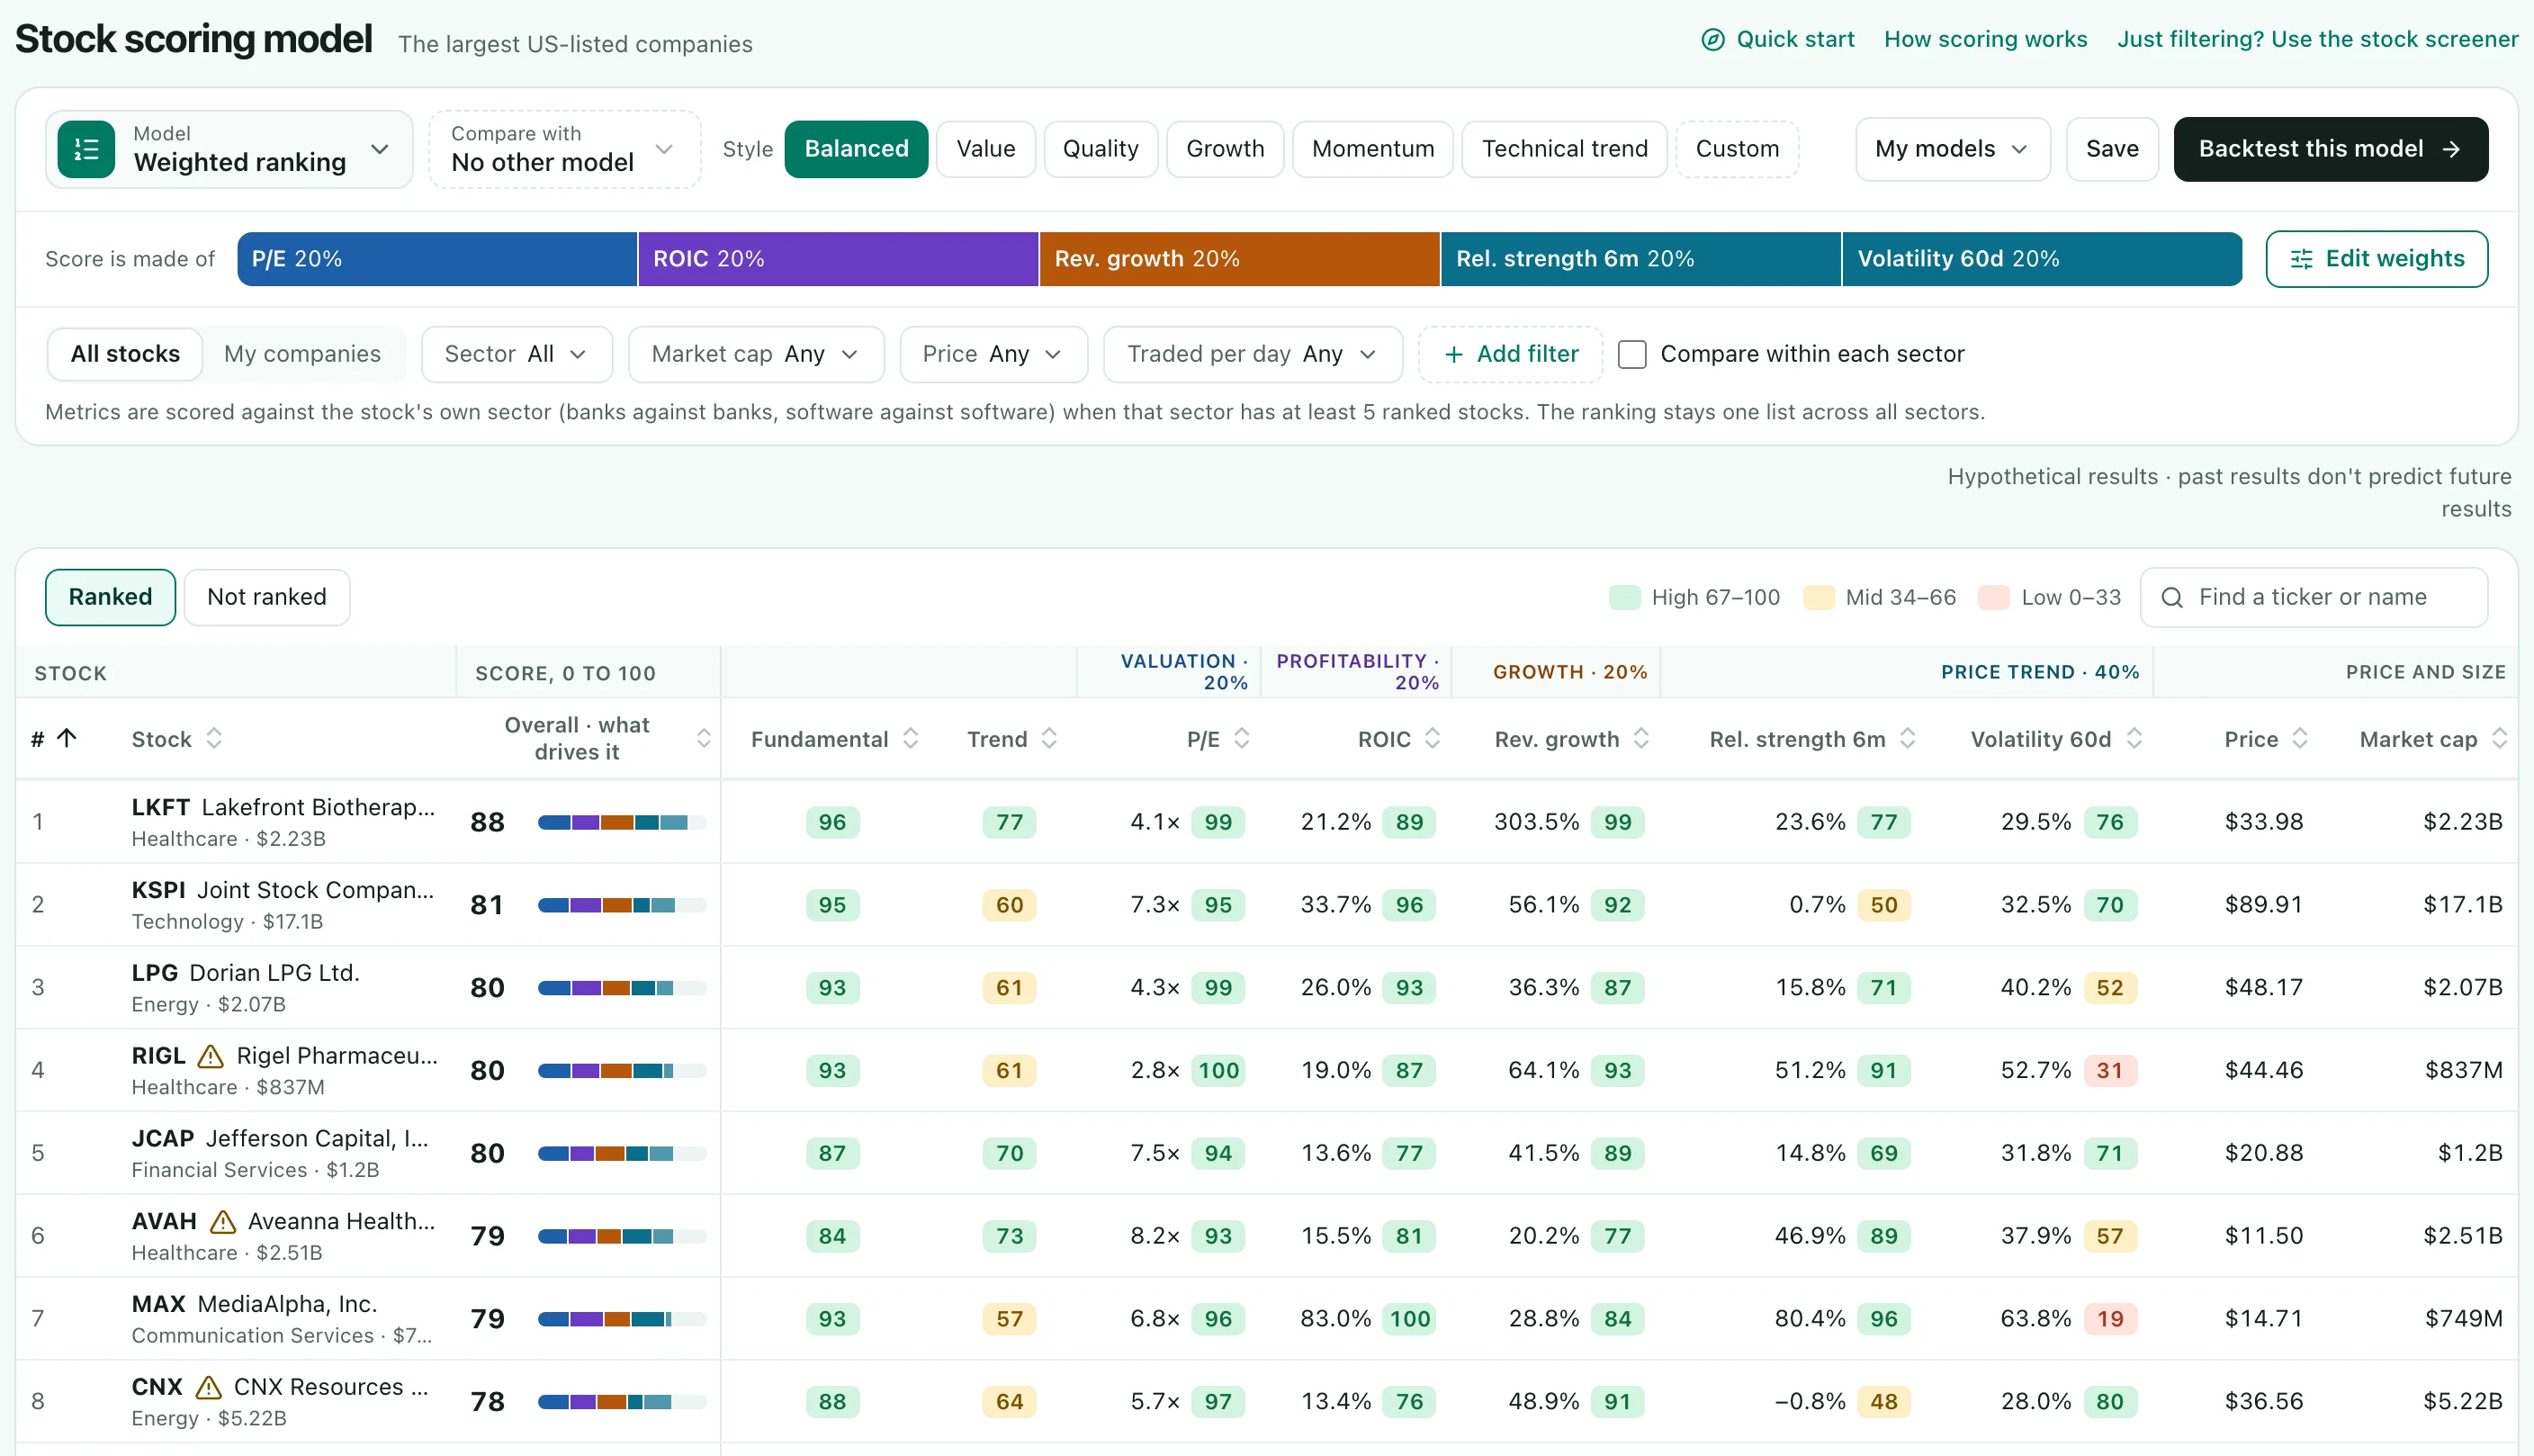
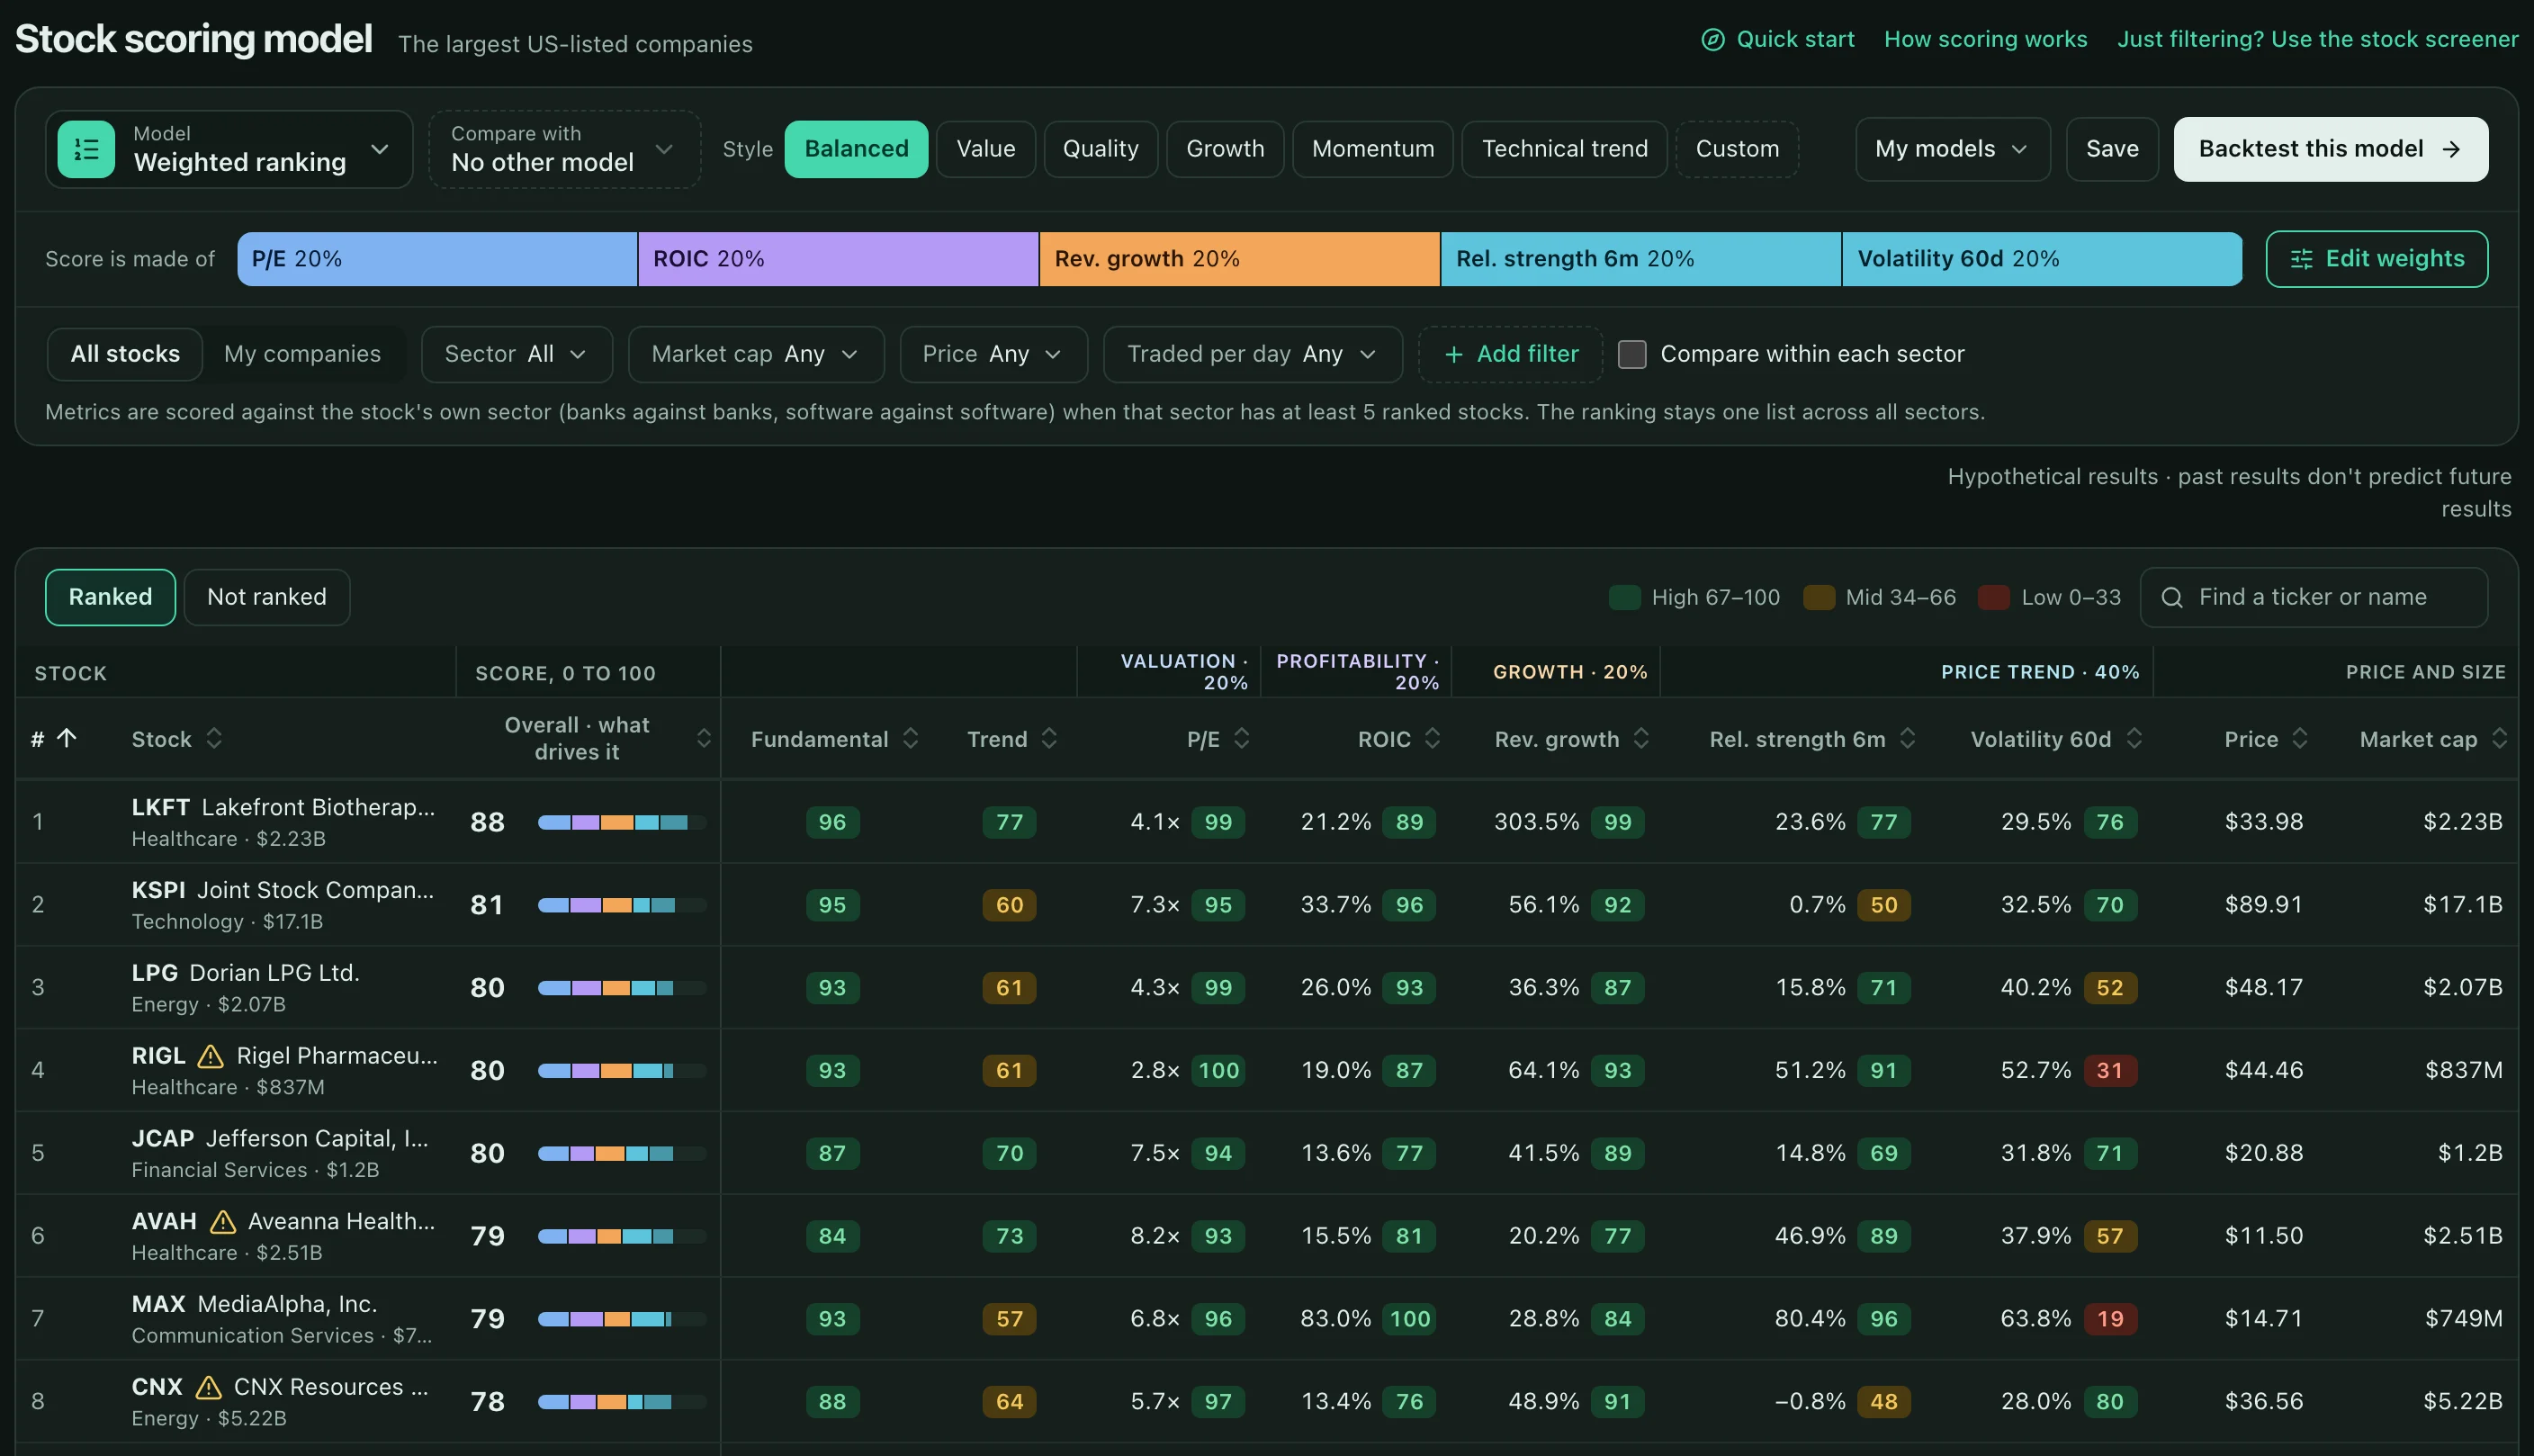
Stock Meadow's scoring model: the model and style, a bar showing what the score is made of, filters, and the ranked table with each stock's score, what drives it and the metrics behind it.
  • ~3,000US stocks
  • 2,000ETFs
  • 9scoring models
  • 103metrics
  • 20 yearsof prices and statements
  • 5 yearsof Congress and insider trades

How it works

From 3,000 stocks to a shortlist, in three steps.

You choose the rules. Stock Meadow does the ranking and shows its working, so the shortlist is yours to research.

Choose a model, or build your own.

Start from one of 9 scoring models, from Joel Greenblatt's Magic Formula to Peter Lynch-style GARP, or pick your own metrics and weights. Each one scores about 3,000 US stocks from 0 to 100, and you can compare two models side by side.

Read the user guide

Pick one to see what it looks for

Magic Formula

Joel Greenblatt's earnings yield plus return on capital

Read the Magic Formula guide

Open any score and see the working.

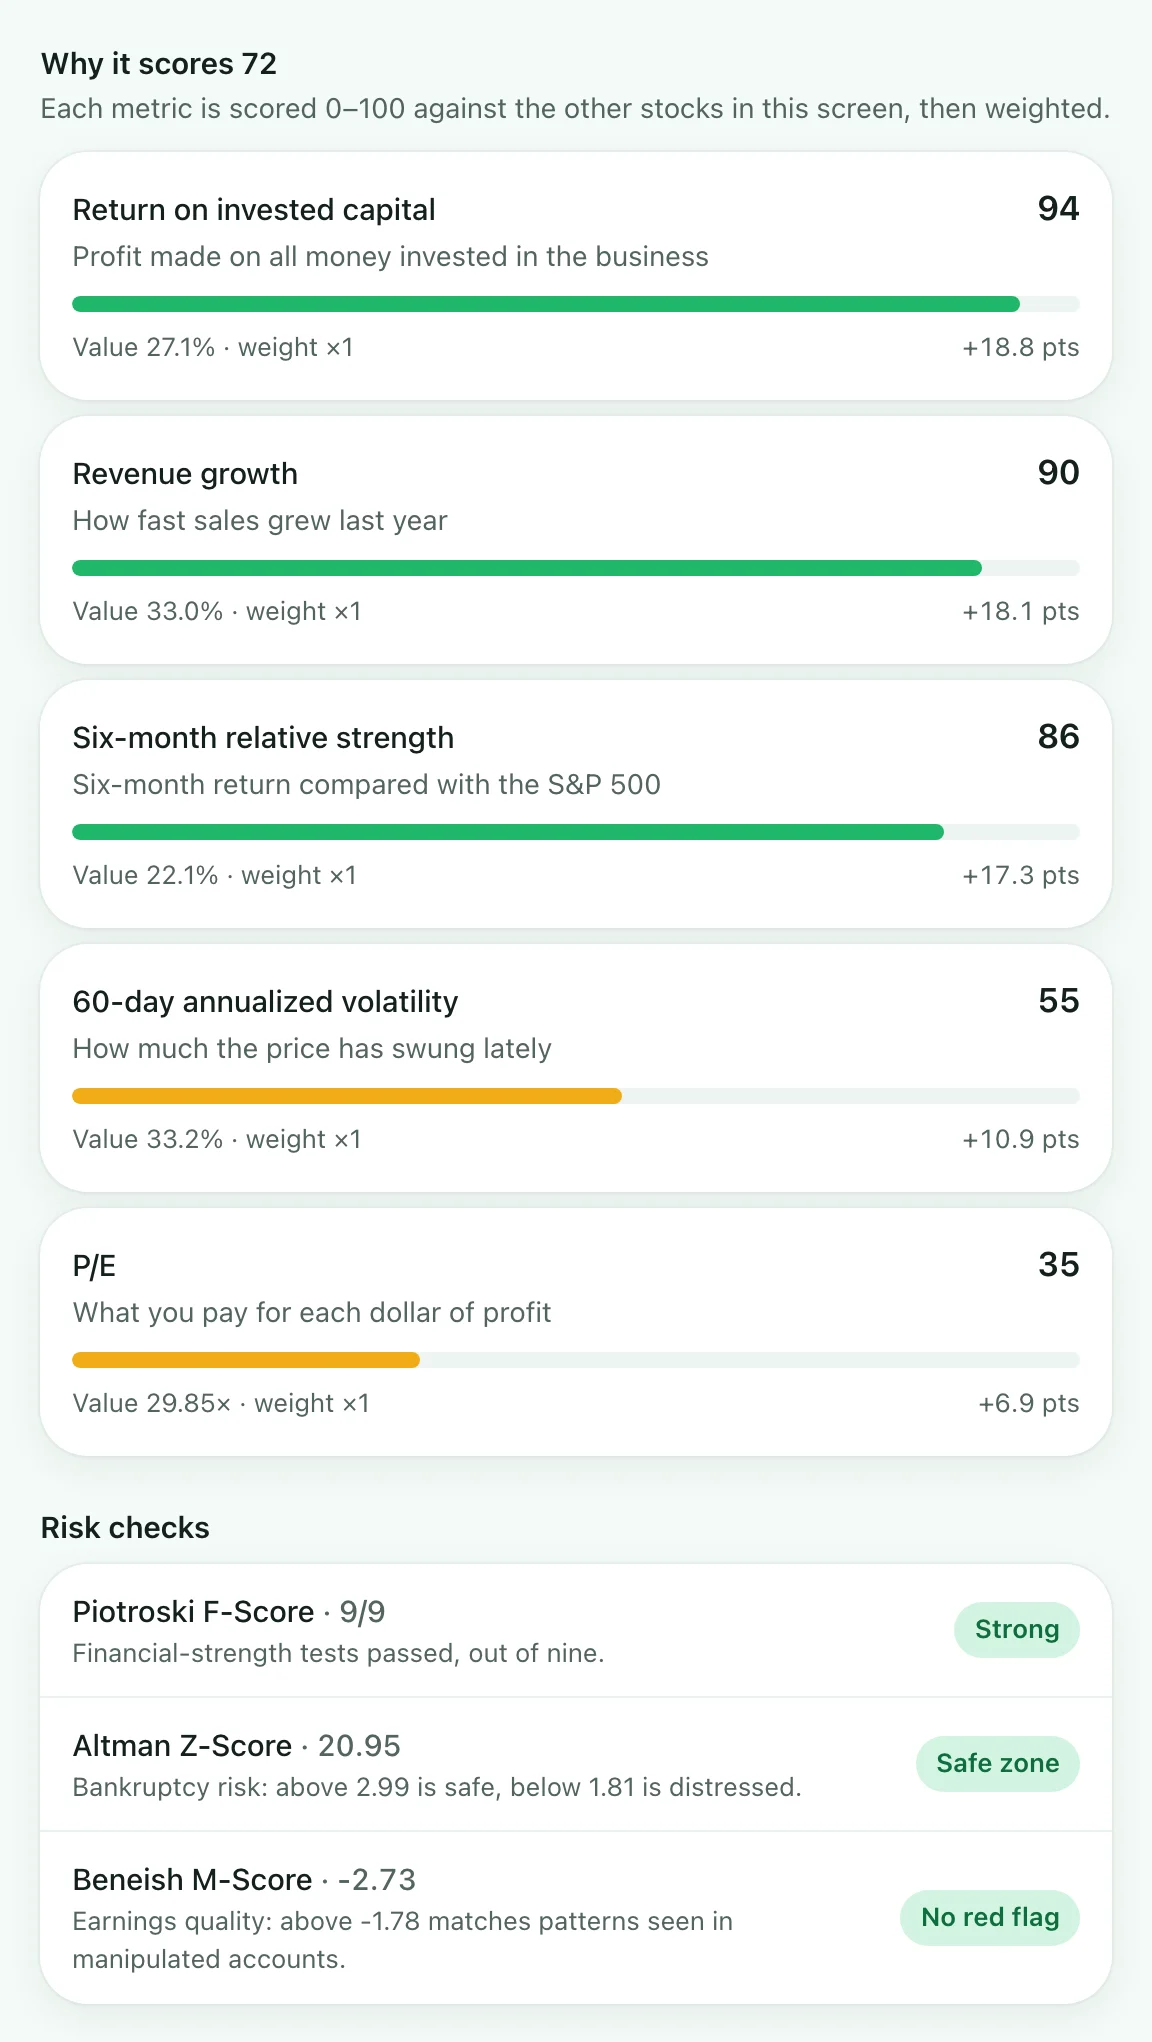
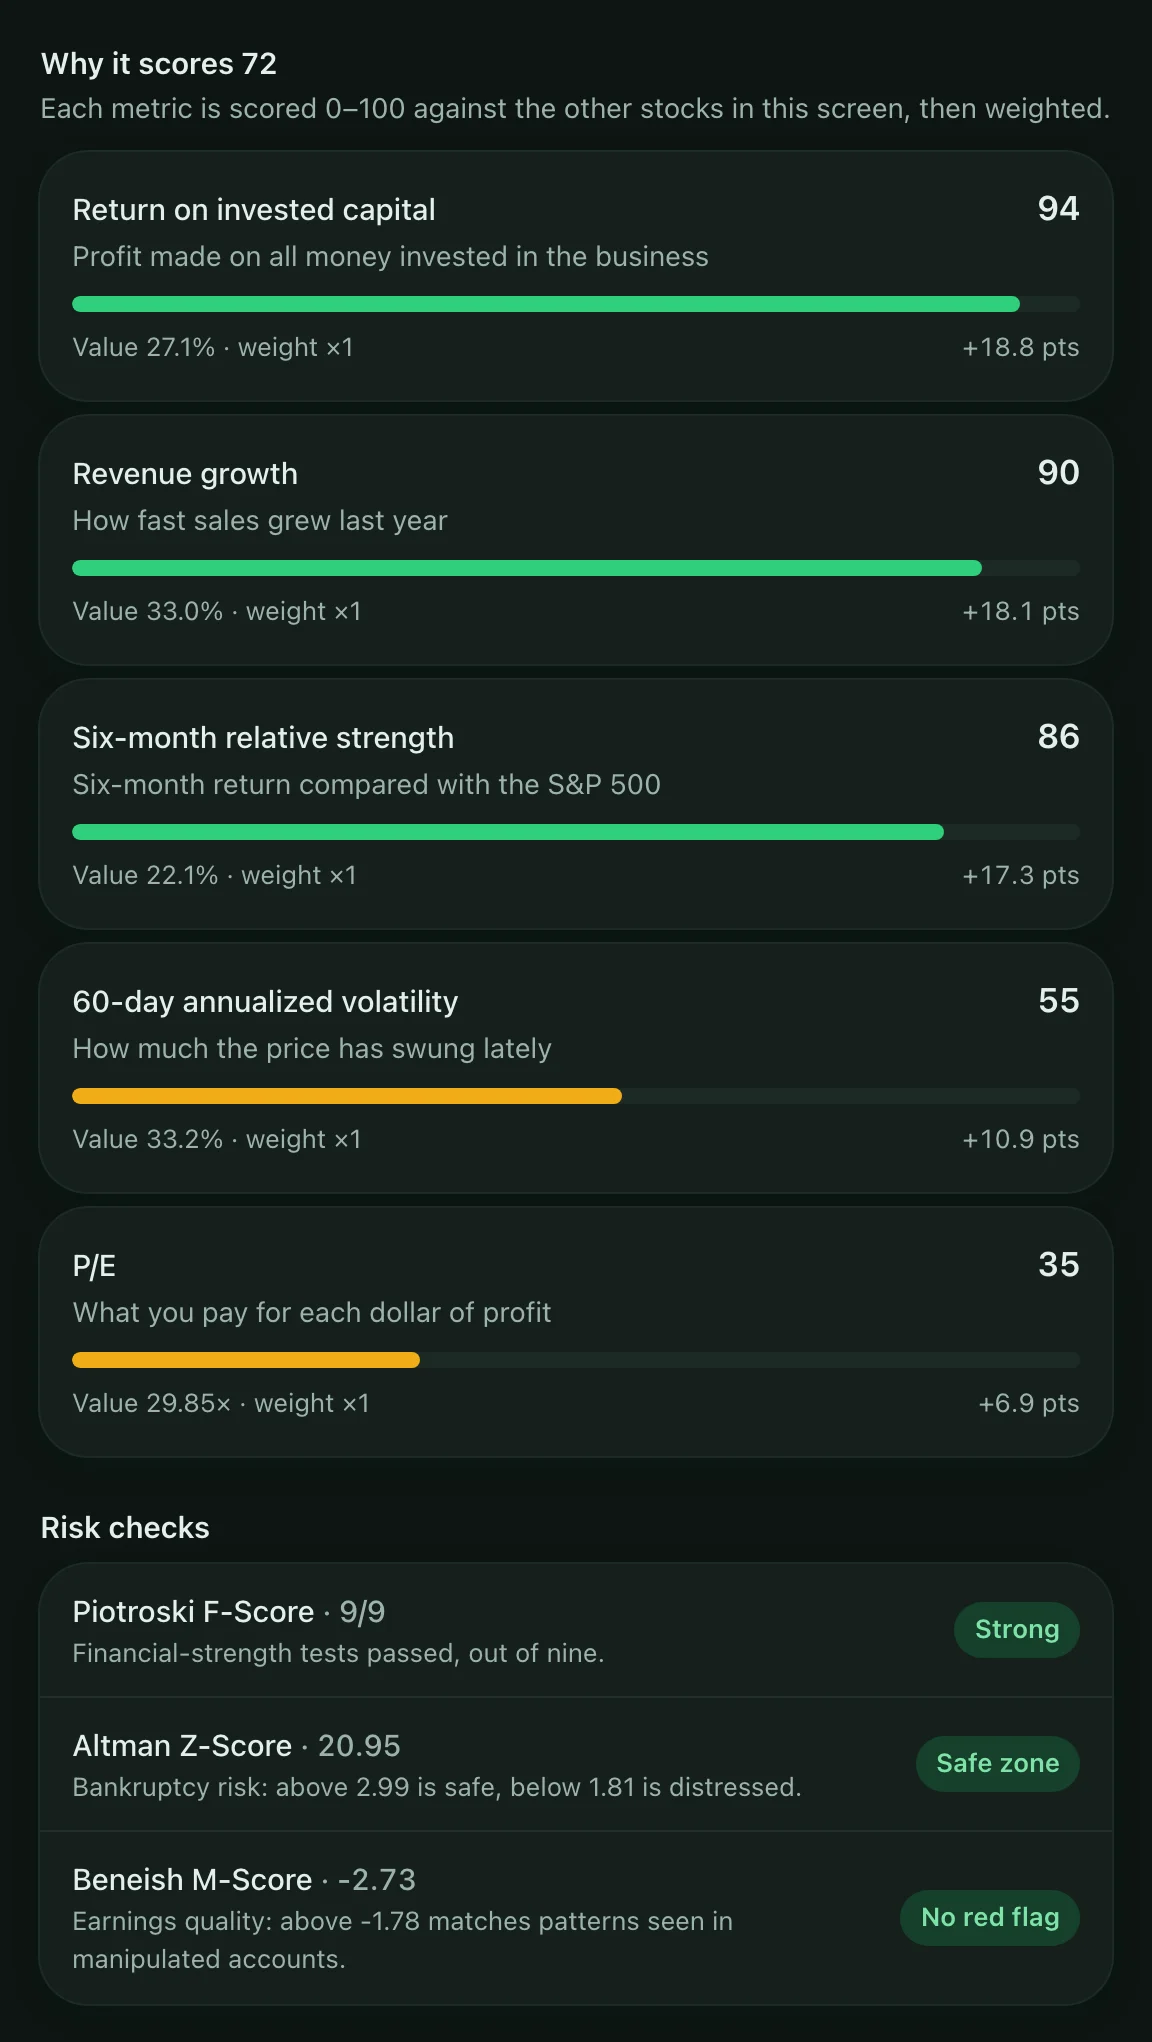
Every metric shows its value, its score from 0 to 100, its weight and the points it adds to the total, with sector context beside it. Three familiar risk checks also sit beside the score: Piotroski F-Score, Altman Z-Score and Beneish M-Score.

See every metric and its formula
Why a stock scores what it does: each metric with its value, its score from 0 to 100, its weight and the points it adds, adding up to the overall score.

Test it on up to 20 years of history.

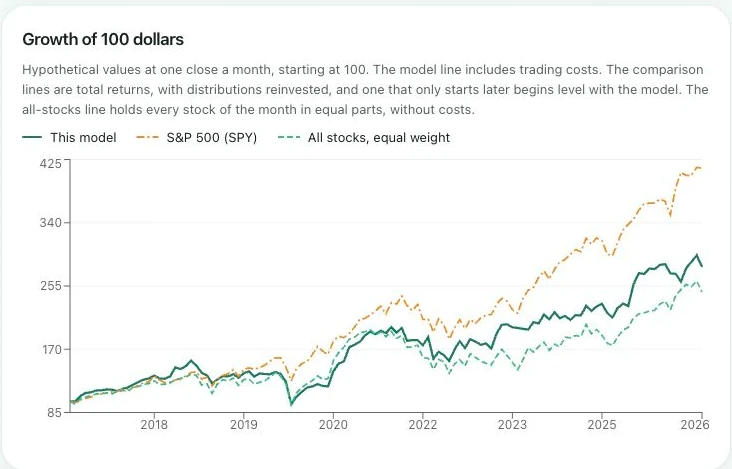
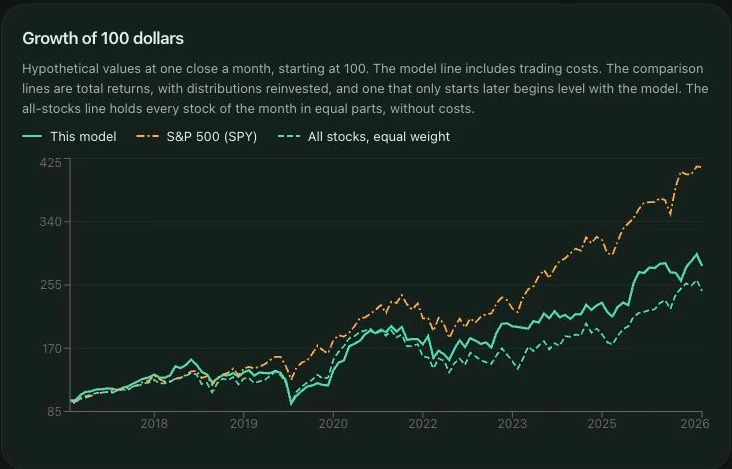
Explore a hypothetical portfolio from 2006 onward. Each month ranks the 3,000 largest US common stocks by your model, including companies that later delisted, using only information that was public at the time. Choose the holdings, rebalance schedule and trade costs, then set it beside the S&P 500: yearly returns, the deepest fall and the time to recover.

For members. Backtest results are hypothetical and simulated, depend on the assumptions and historical data, and do not predict future performance. Metrics that cannot be rebuilt from historical records are left out and listed.

How the backtest works
A scoring-model backtest: comparison chips for the S&P 500 and other index funds, result tiles (annual return, total return, volatility, deepest fall, Sharpe ratio, beta, turnover, cost drag) and a Growth of 100 dollars chart against the S&P 500 and all stocks. Hypothetical, simulated results.

Follow the money · for members

See what Congress, insiders and well-known investors are trading.

Three trackers built from public filings, each with five years of history and linked from every stock's own page.

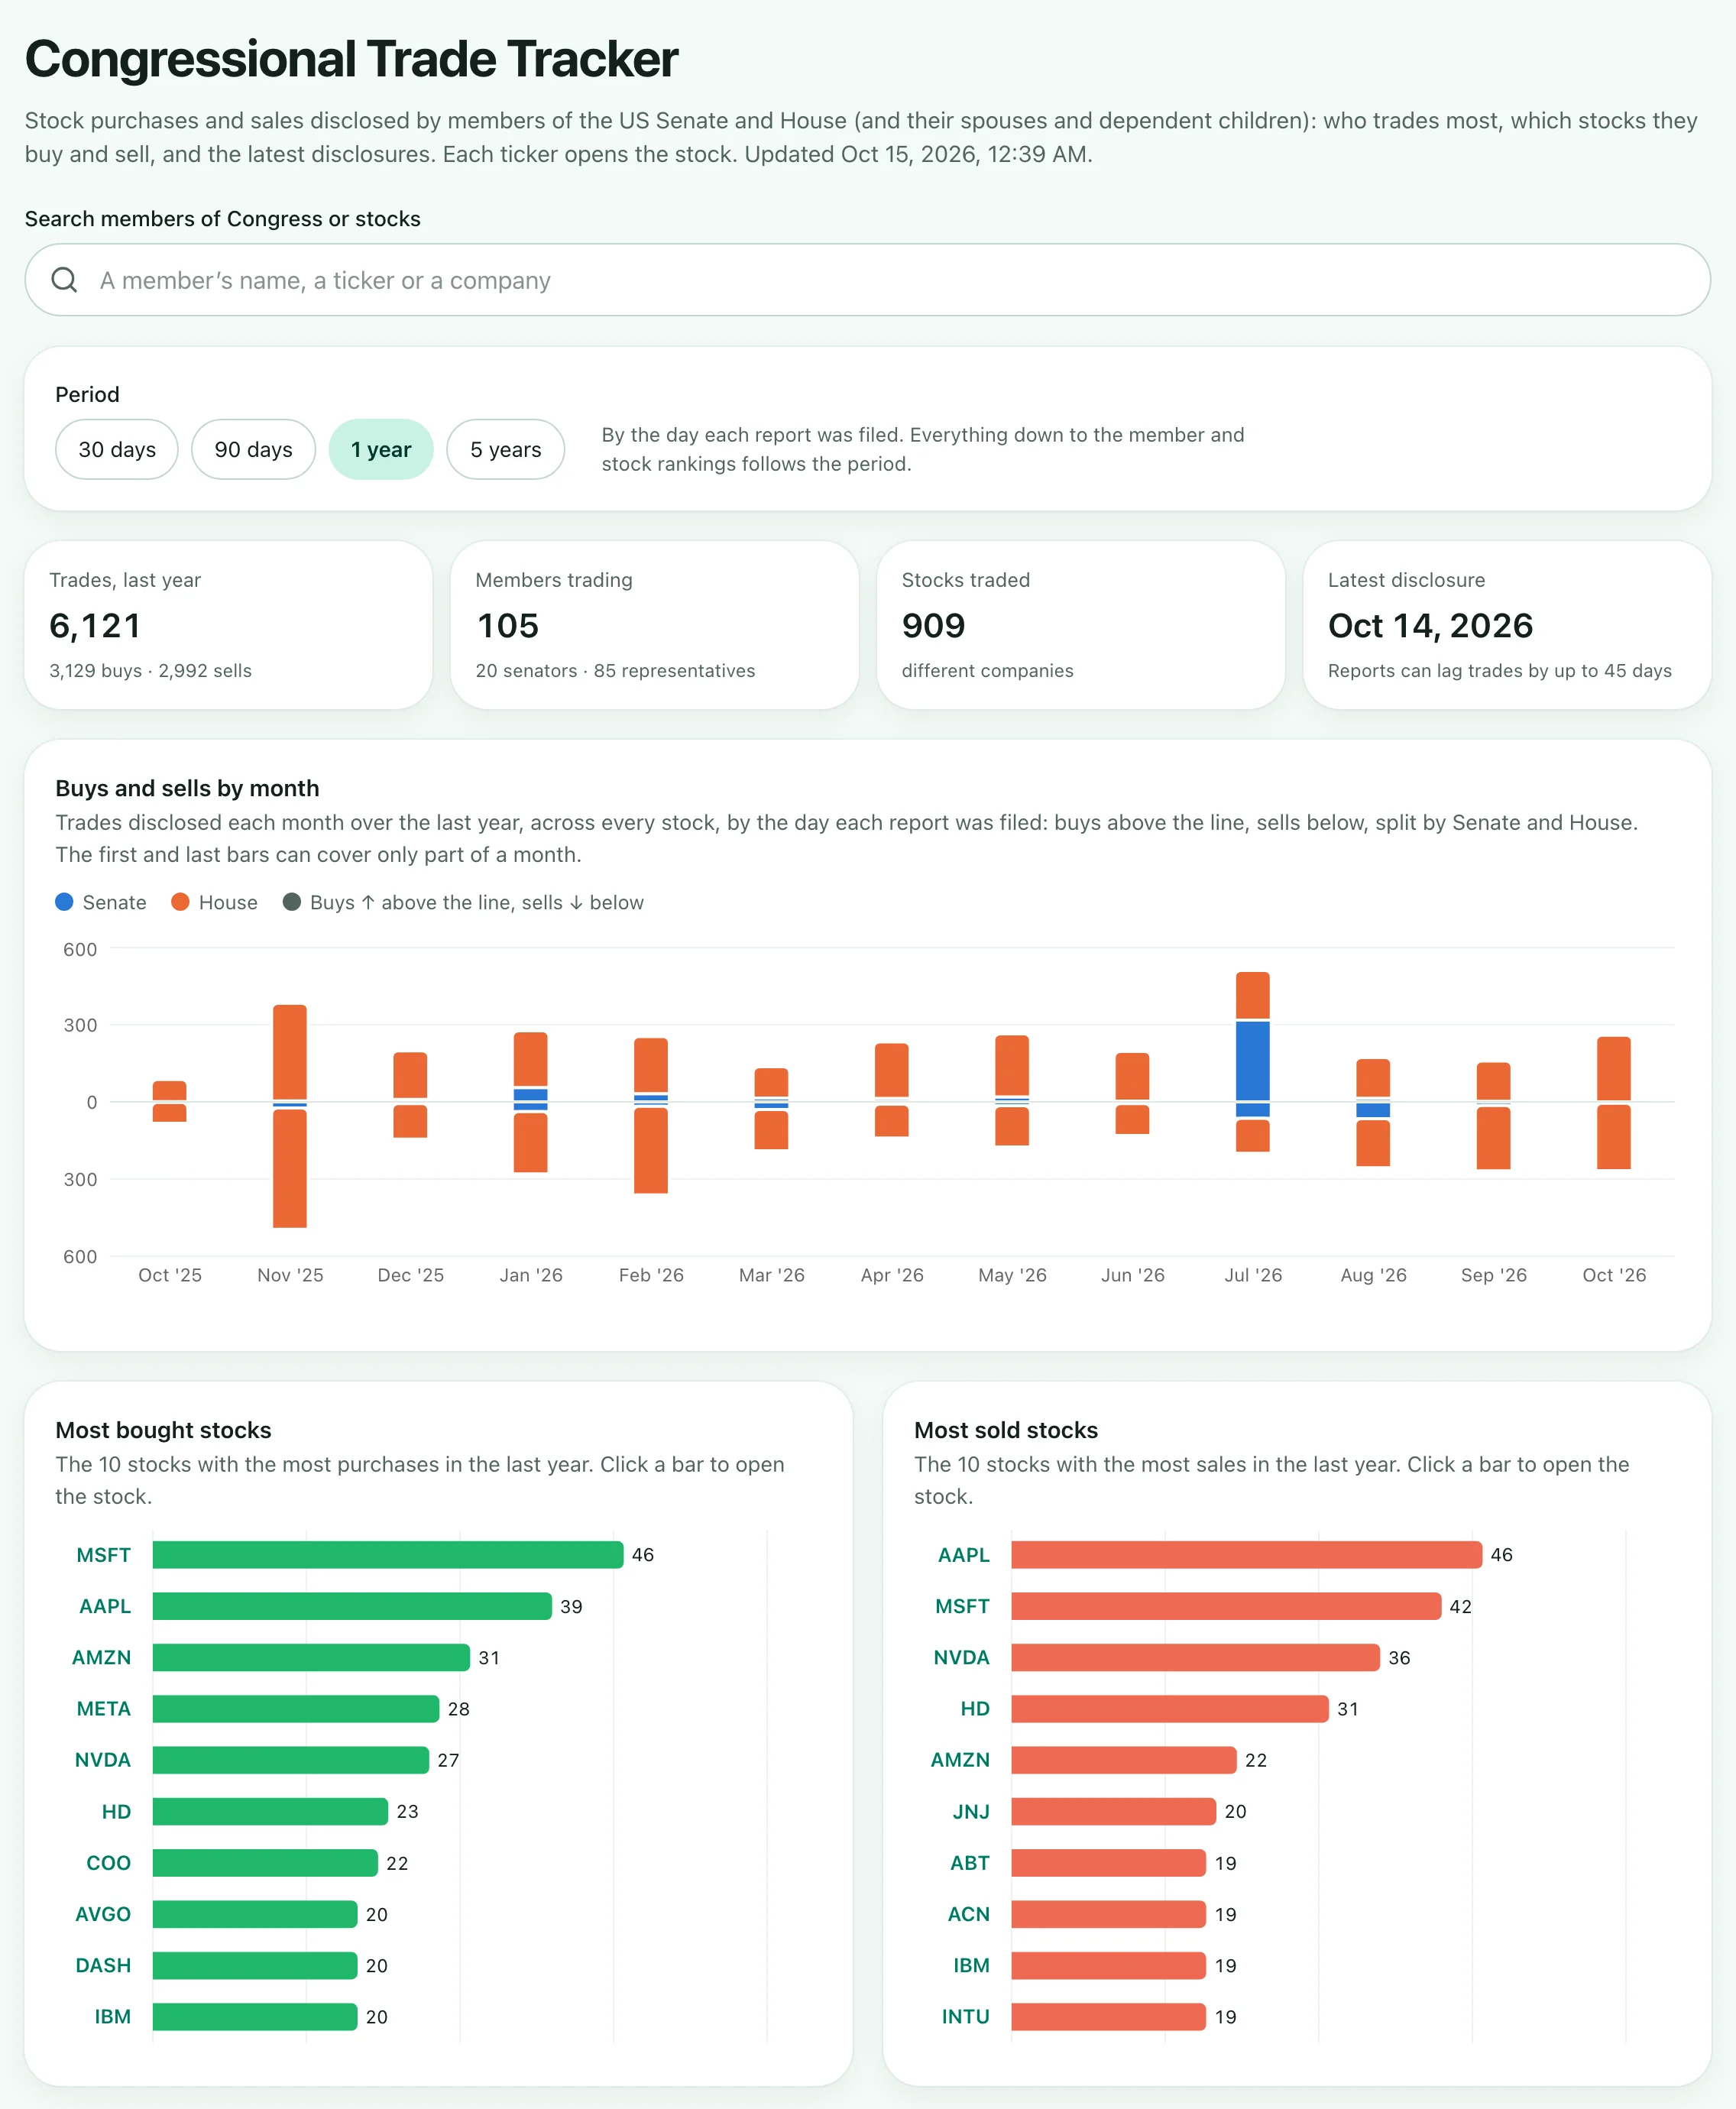
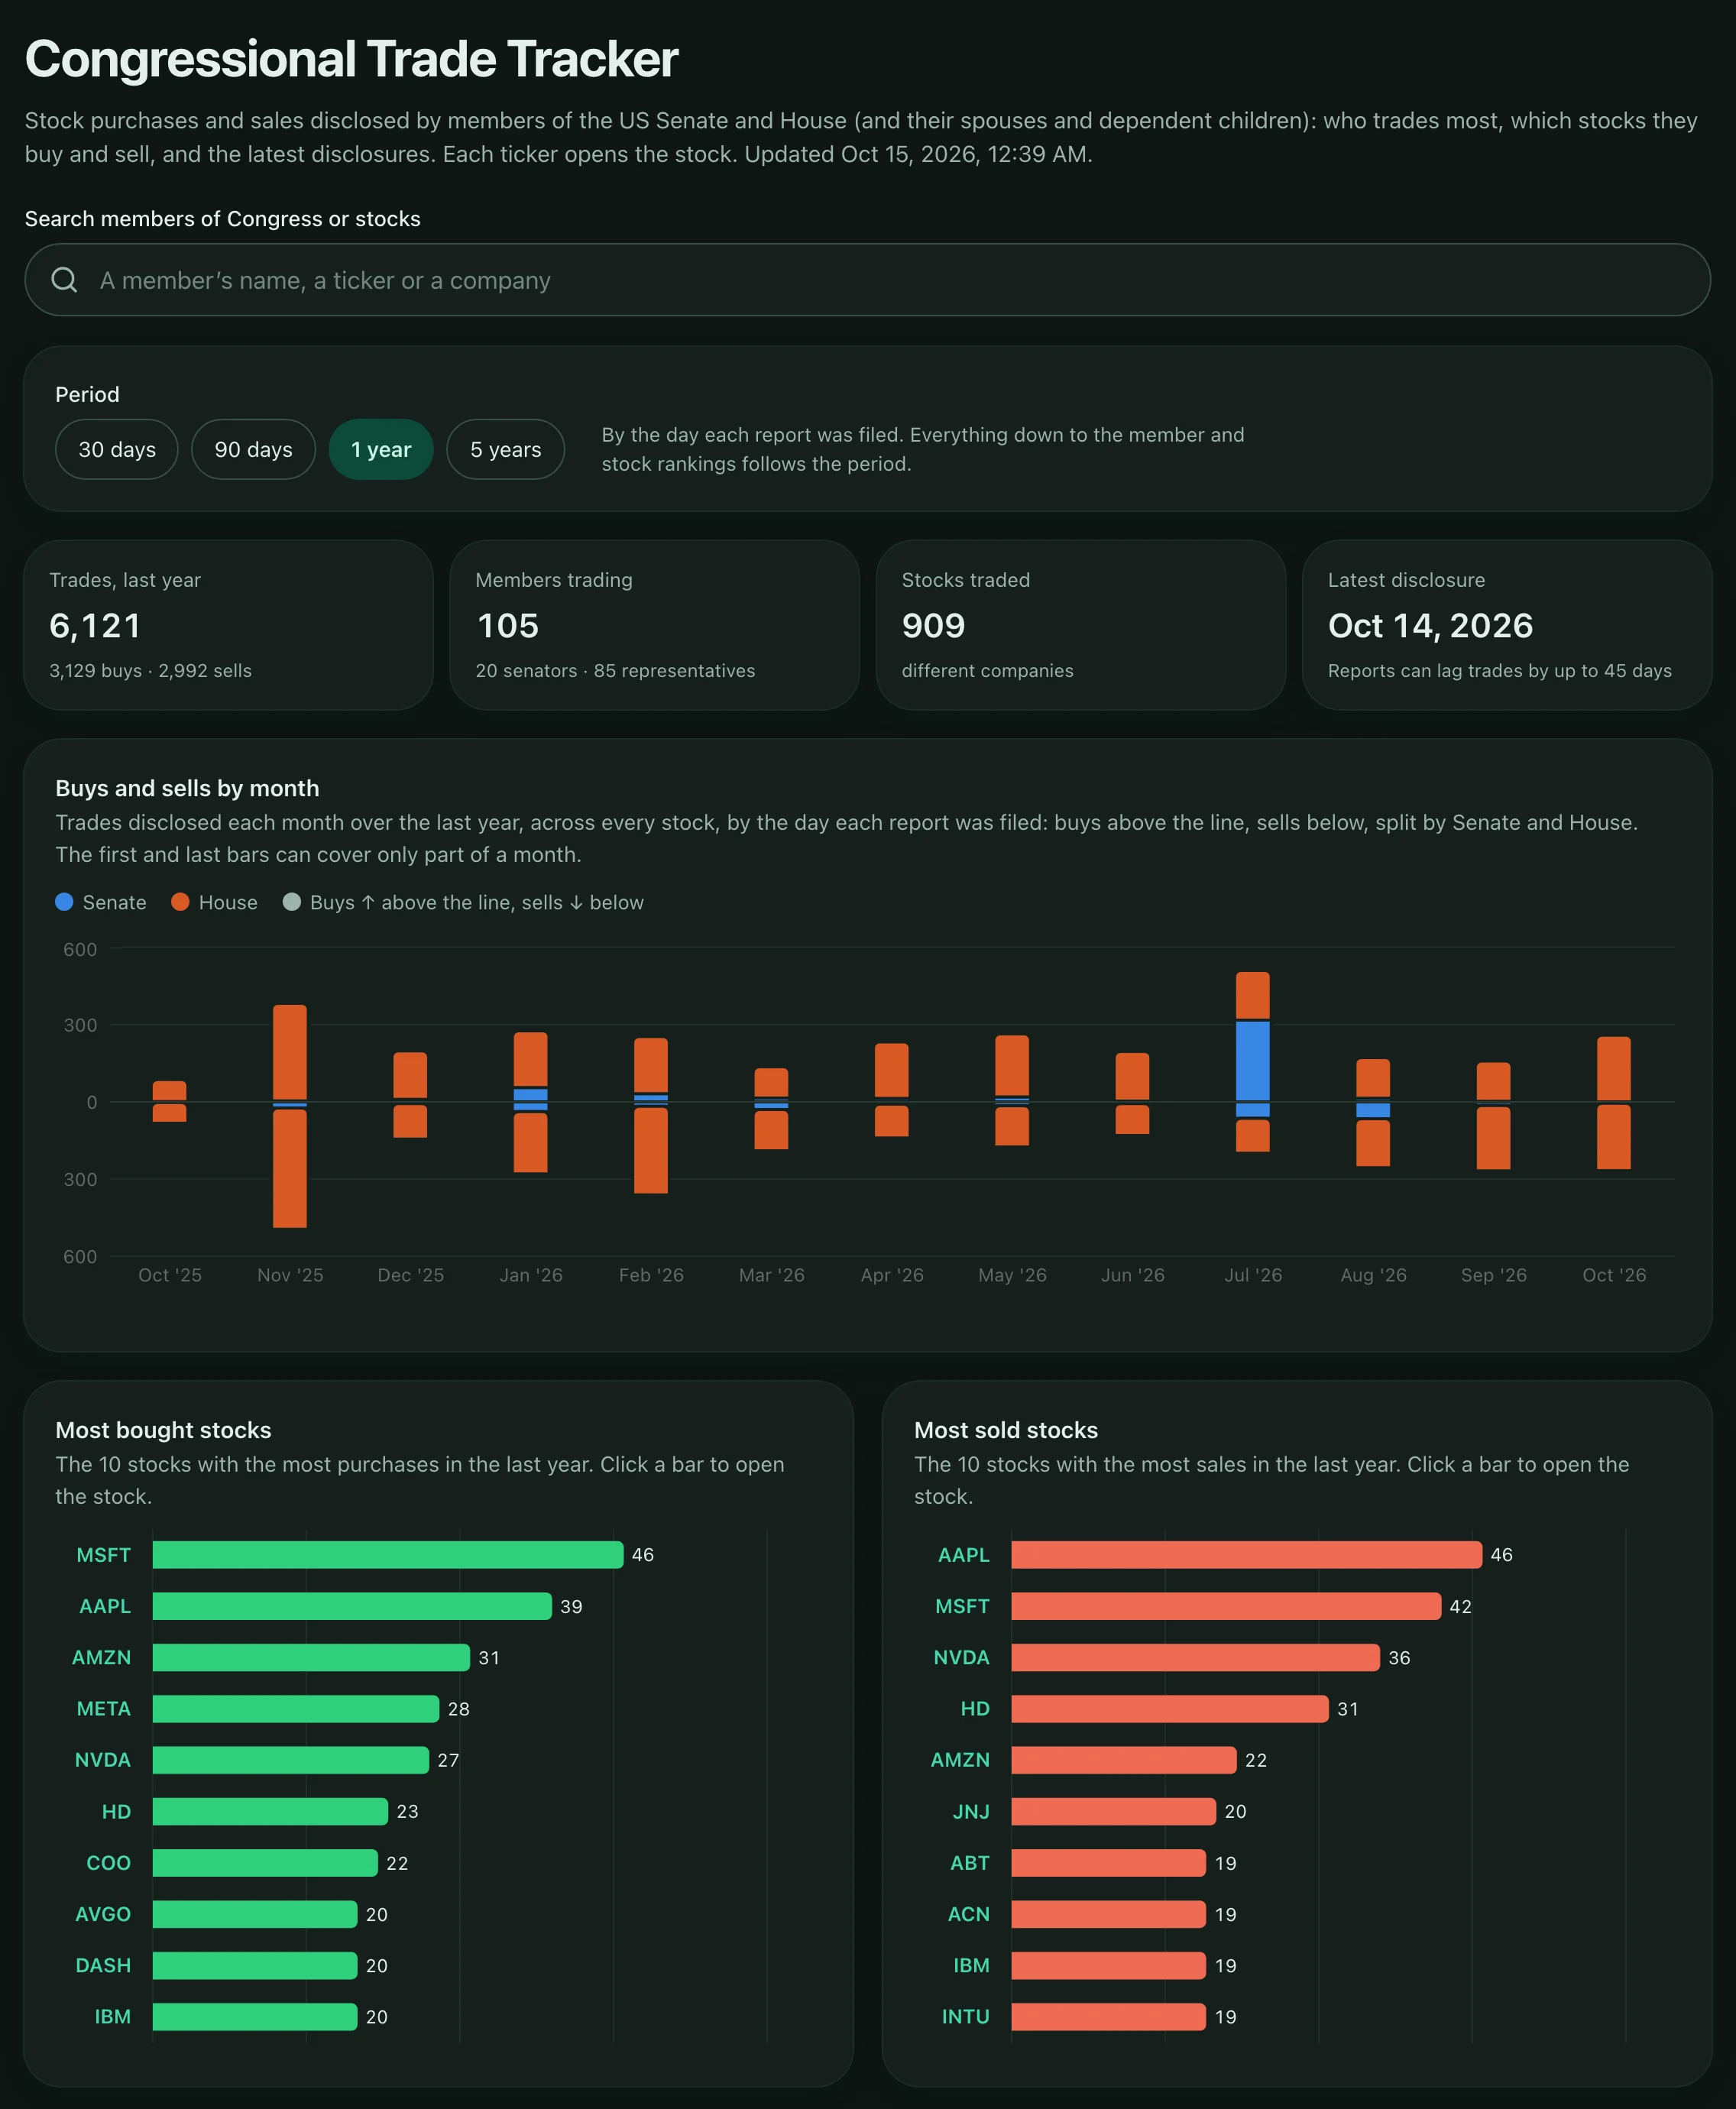
  • The Congressional Trade Tracker: counts of trades, a chart of buys and sells by month, and the most bought and most sold stocks.

    Congress tracker

    Stock purchases and sales disclosed by US senators and representatives in the stocks we cover (about 3,000 US-listed companies): 5 years of history, buys against sells, rankings, member profiles and search.

    Disclosures can come up to 45 days after a trade, and amounts are reported as ranges, so the tracker counts trades.

    How the Congress tracker works
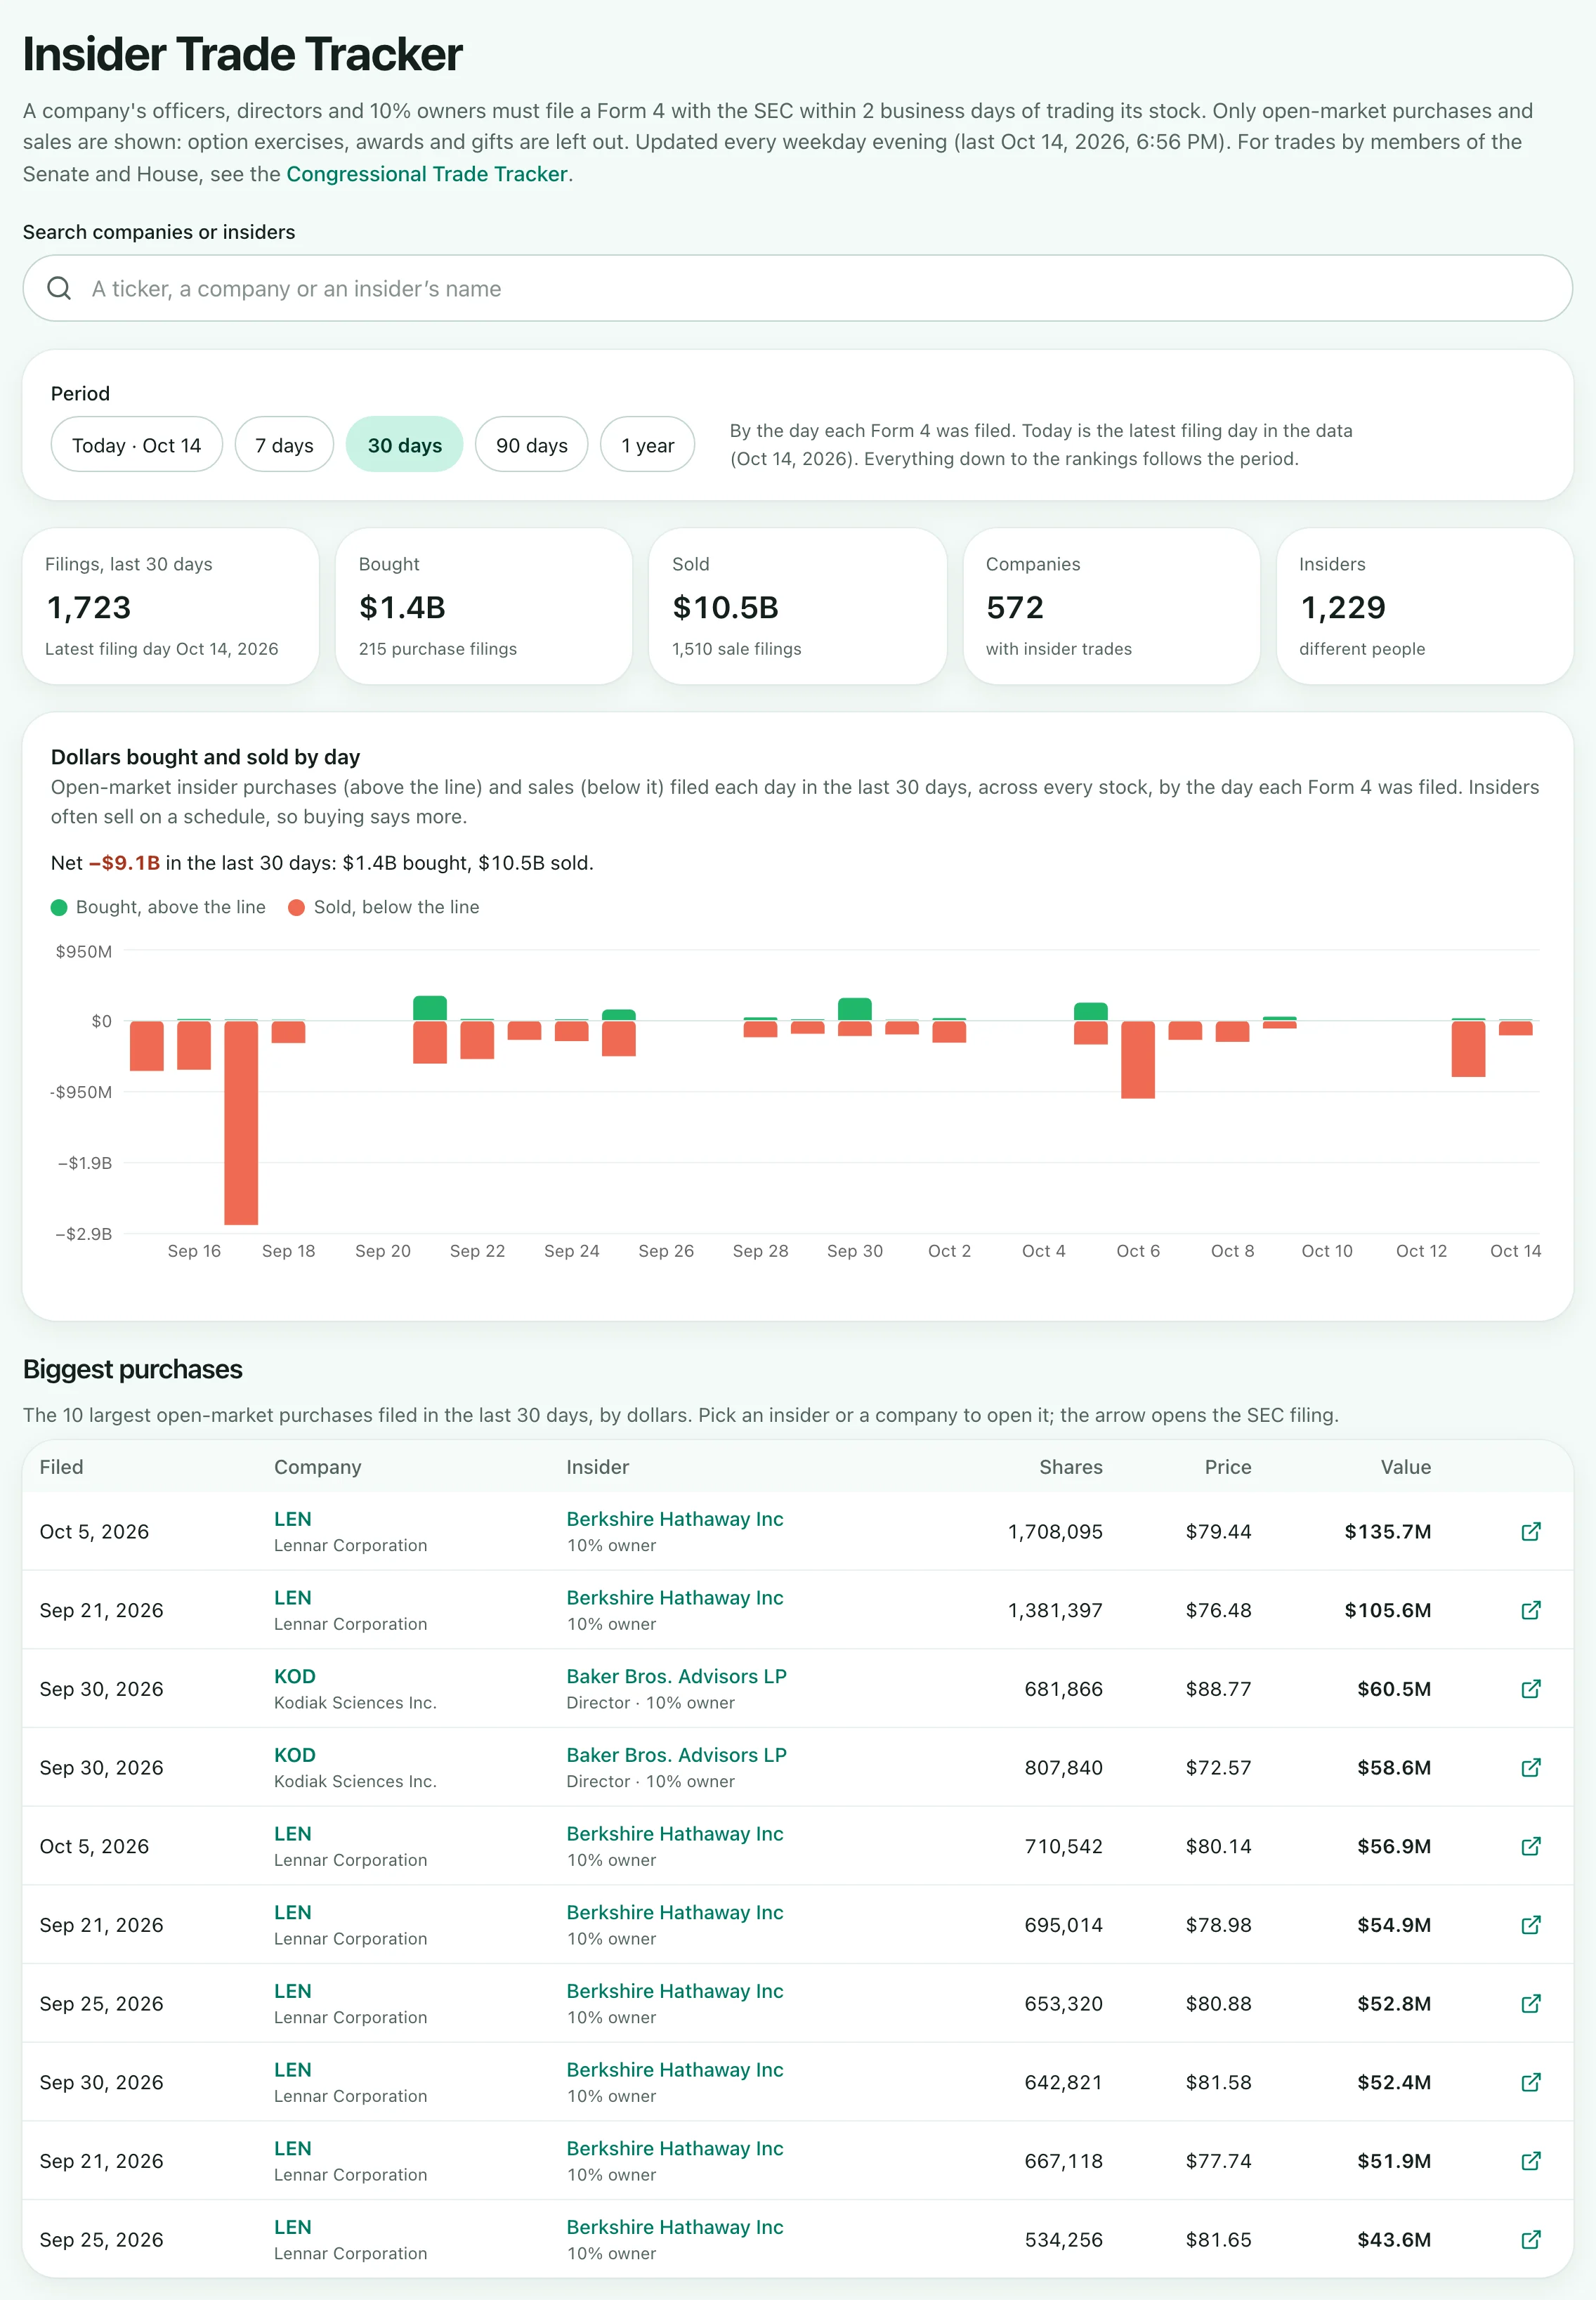
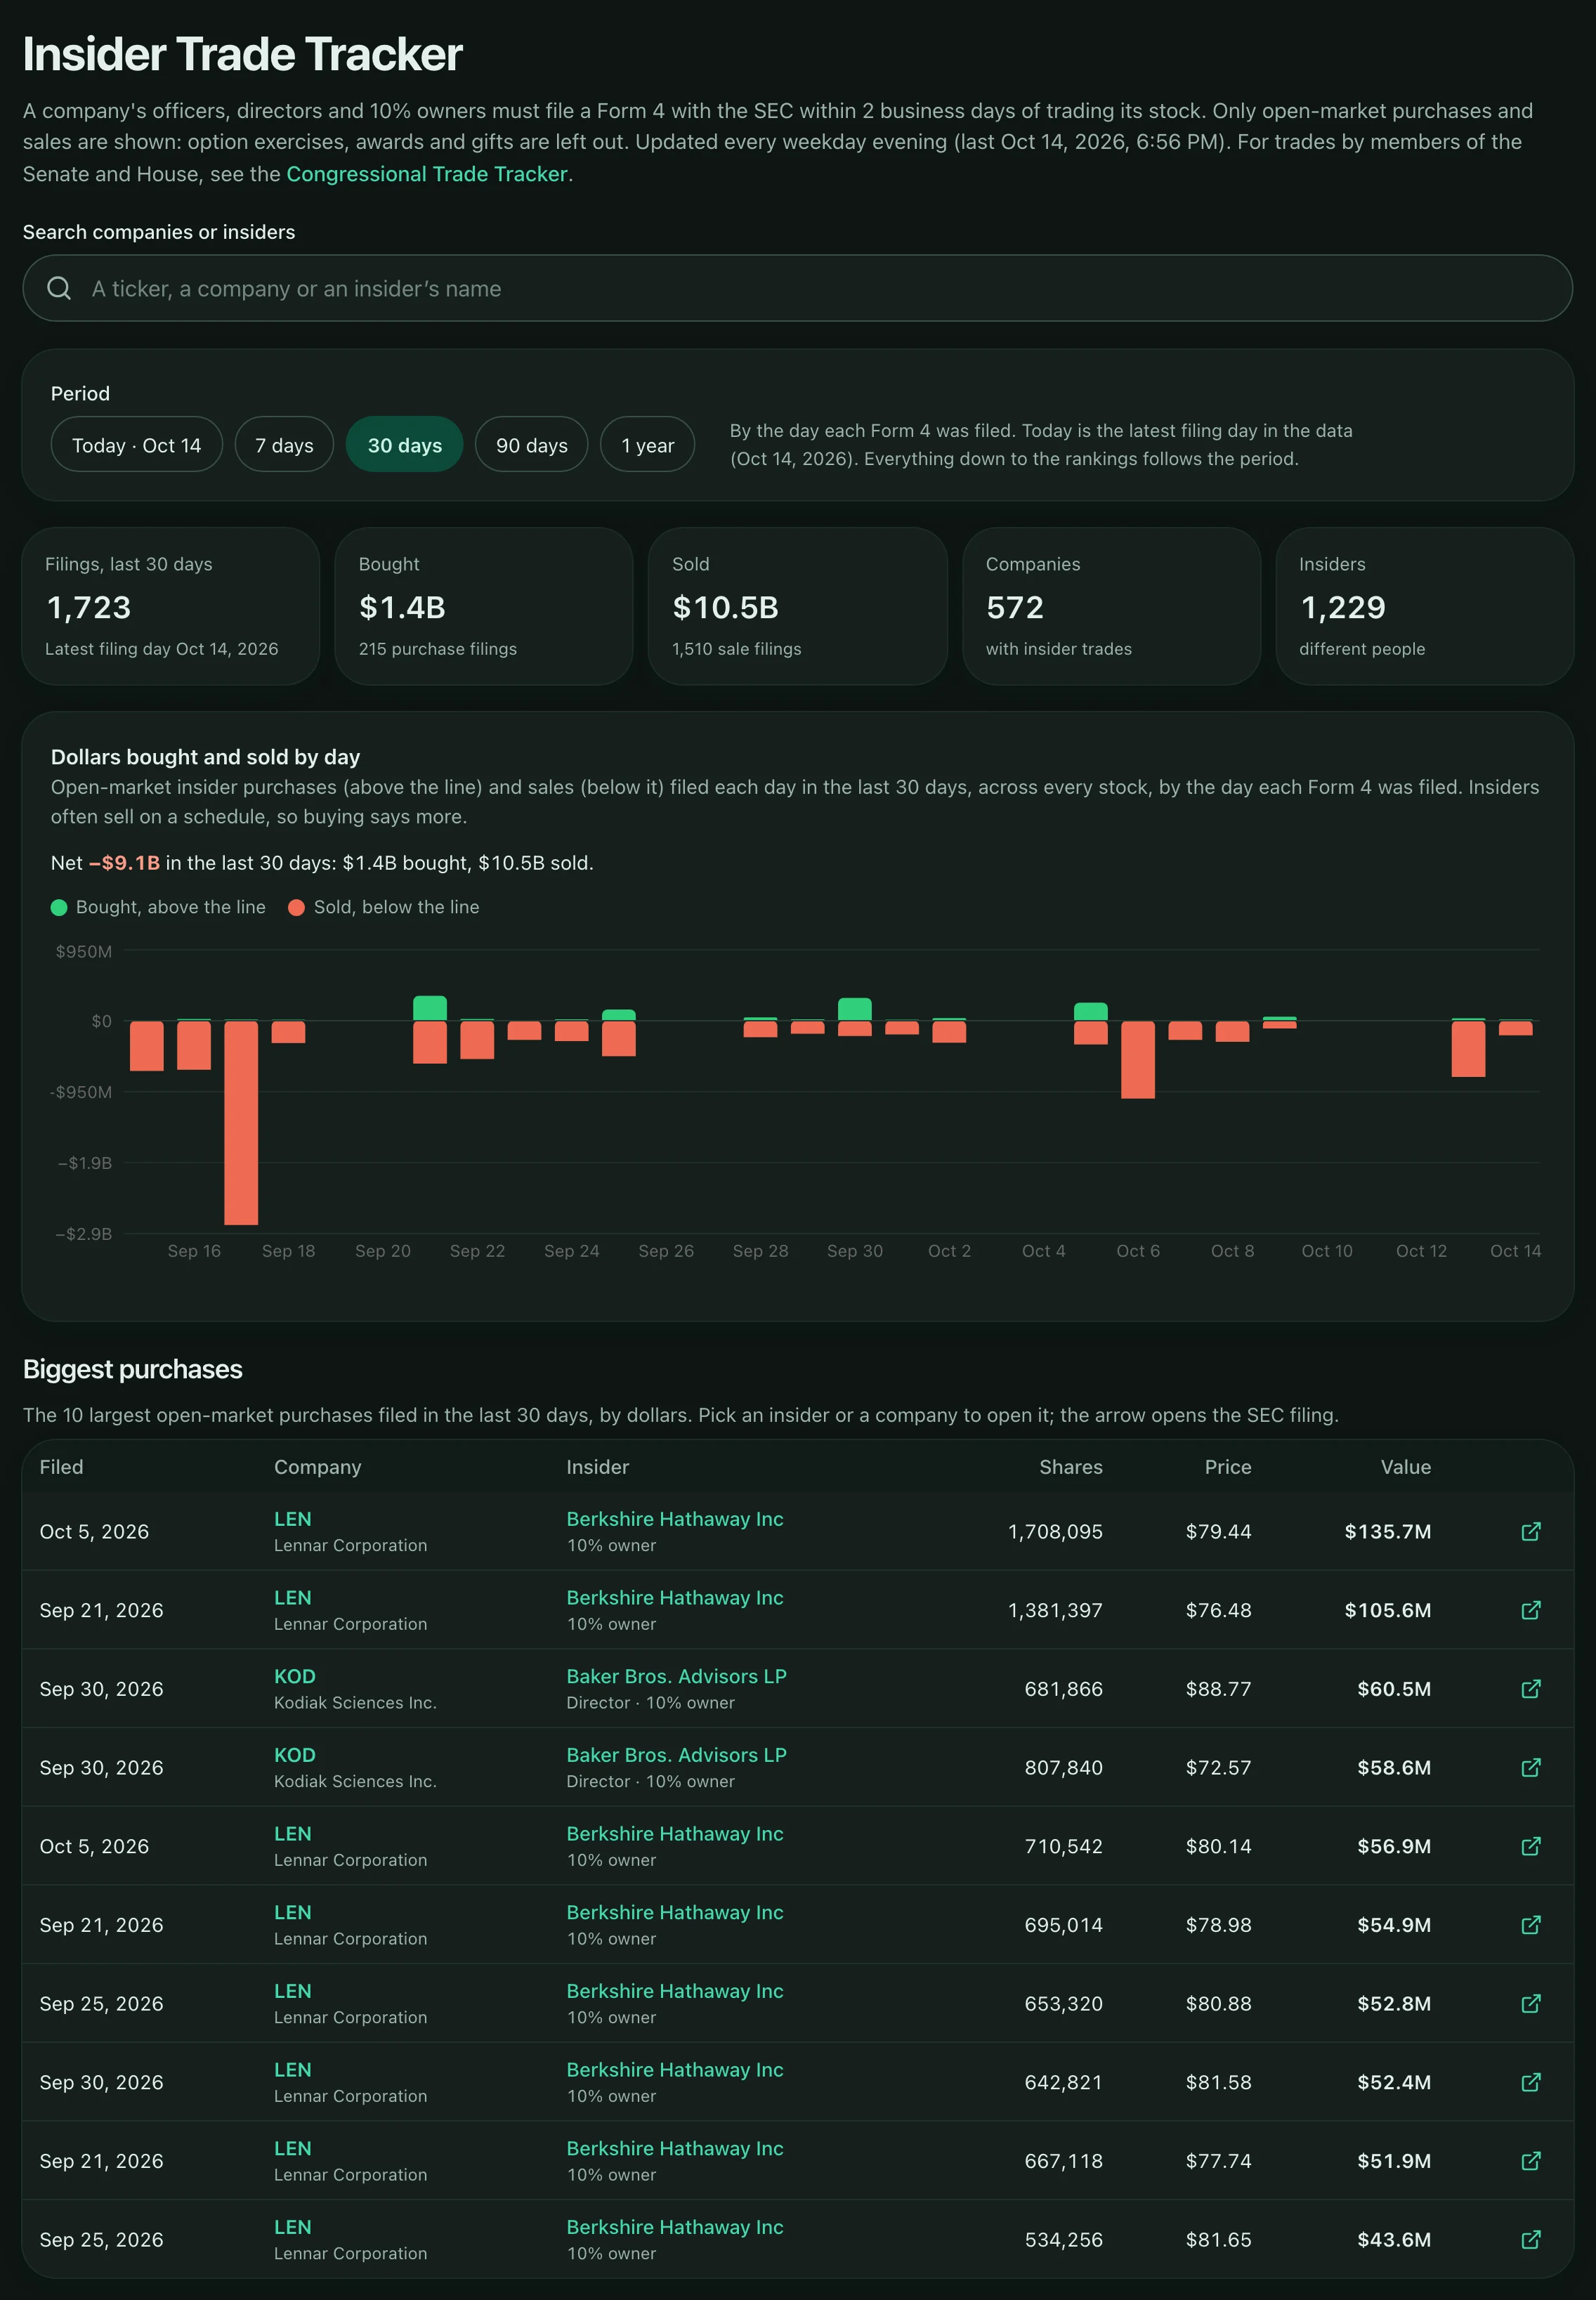
  • The Insider Trade Tracker: counts of filings, dollars bought and sold by day, and the biggest insider purchases.

    Insider tracker

    Open-market purchases and sales by officers, directors and 10% owners of the stocks we cover: the biggest trades, cluster buying and the latest filings, with 5 years of history.

    From SEC Form 4 filings. Dollar totals leave out trades filed in a foreign currency.

    How the Insider tracker works
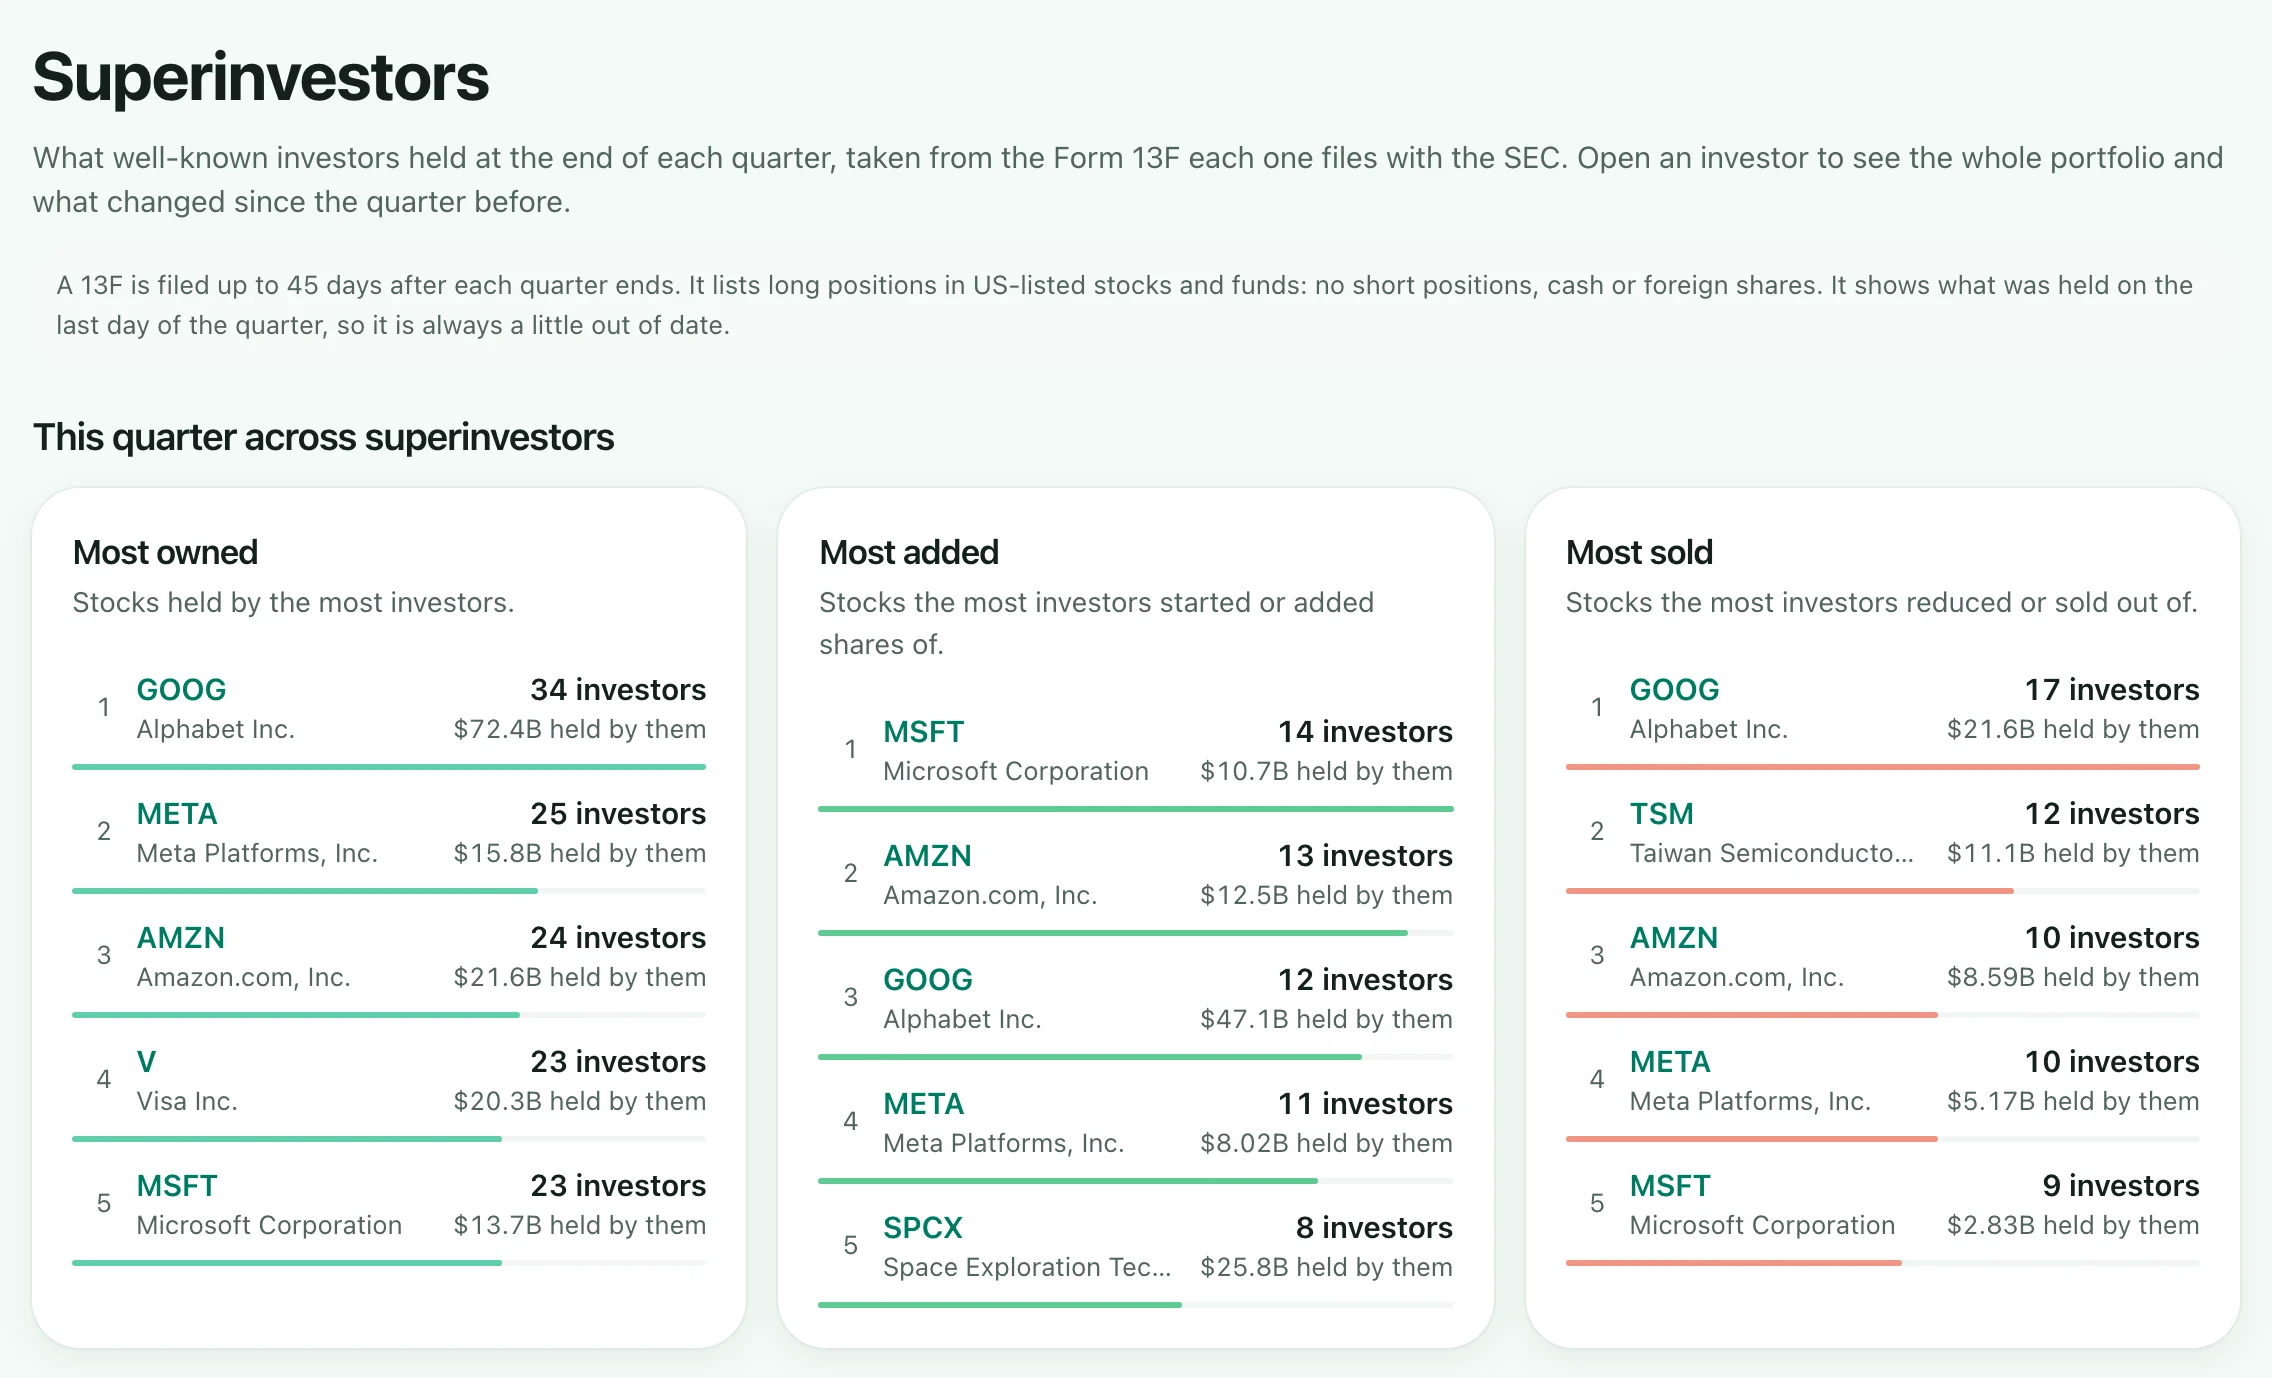
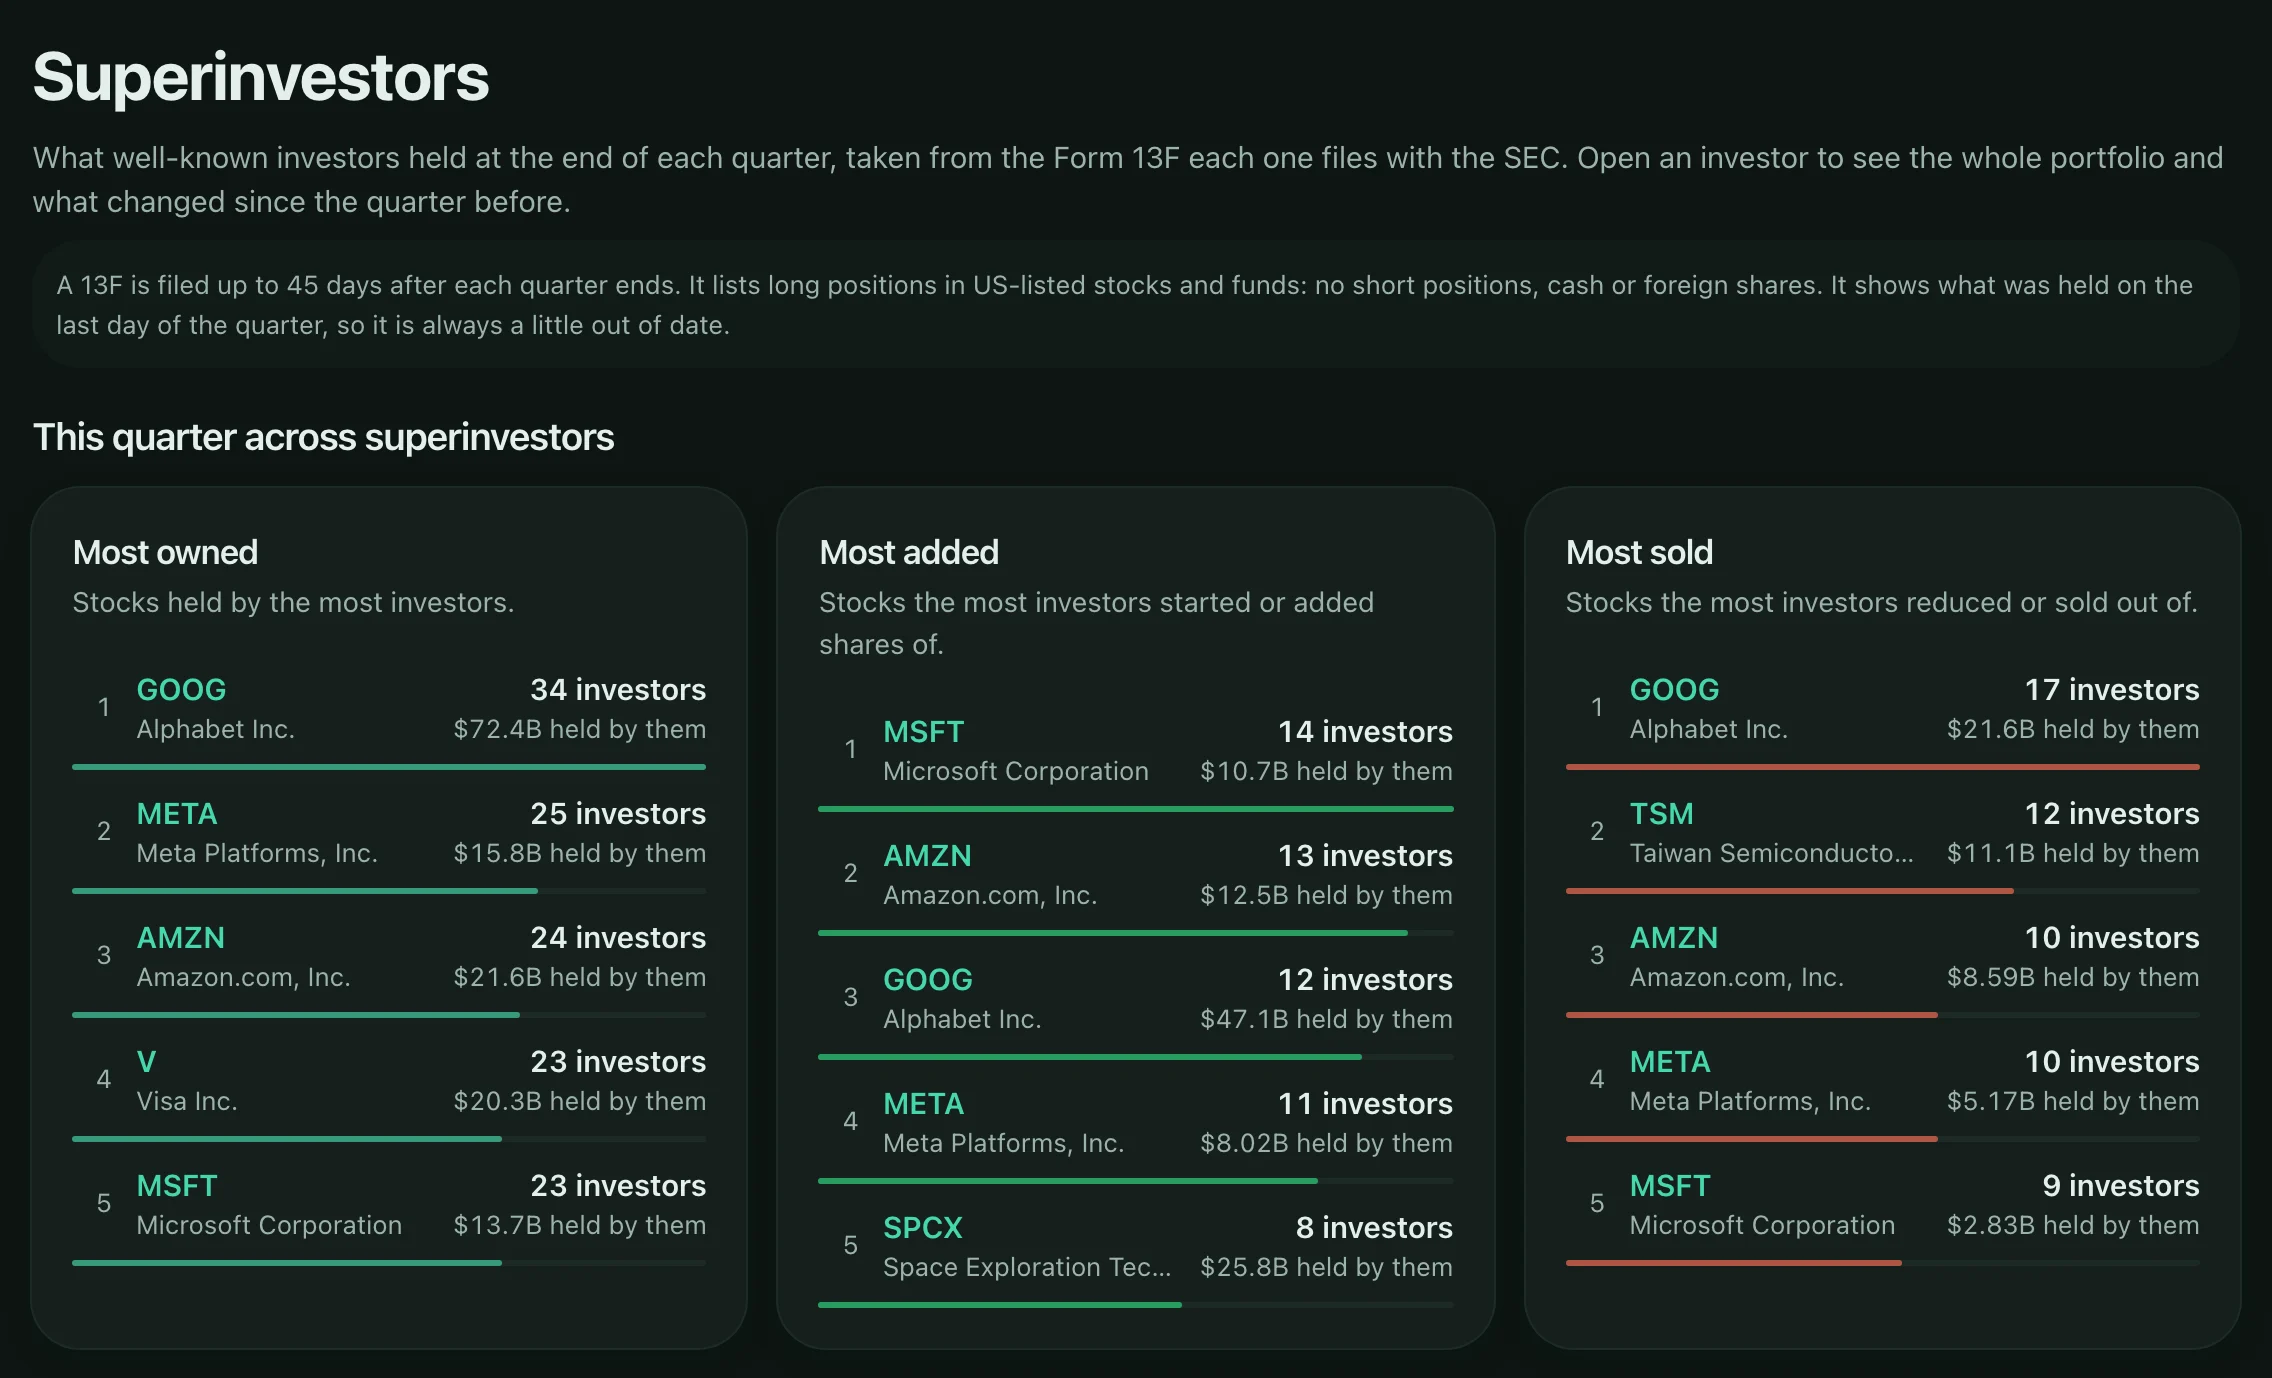
  • The Super Investors page: a search box for investors, firms and tickers, two summary boxes (This quarter's moves and Investors we follow), an indigo This quarter's moves section with the stocks held by the most investors, the ones most of them added to and the ones most of them reduced or sold out of, and a teal Investors we follow table with each investor's reported value, positions, largest holdings, changes and filing date.

    Super Investors

    The quarterly portfolios of about 50 well-known investors over five years: what they hold, what they added, reduced and sold, and the stocks most of them own.

    From SEC 13F filings, which can arrive up to 45 days after quarter end. Reports cover long positions in US-listed stocks; they do not show shorts, cash, bonds or most foreign shares.

    How Super Investors works

Also included

The rest of your research, in the same place.

A page for every stock.

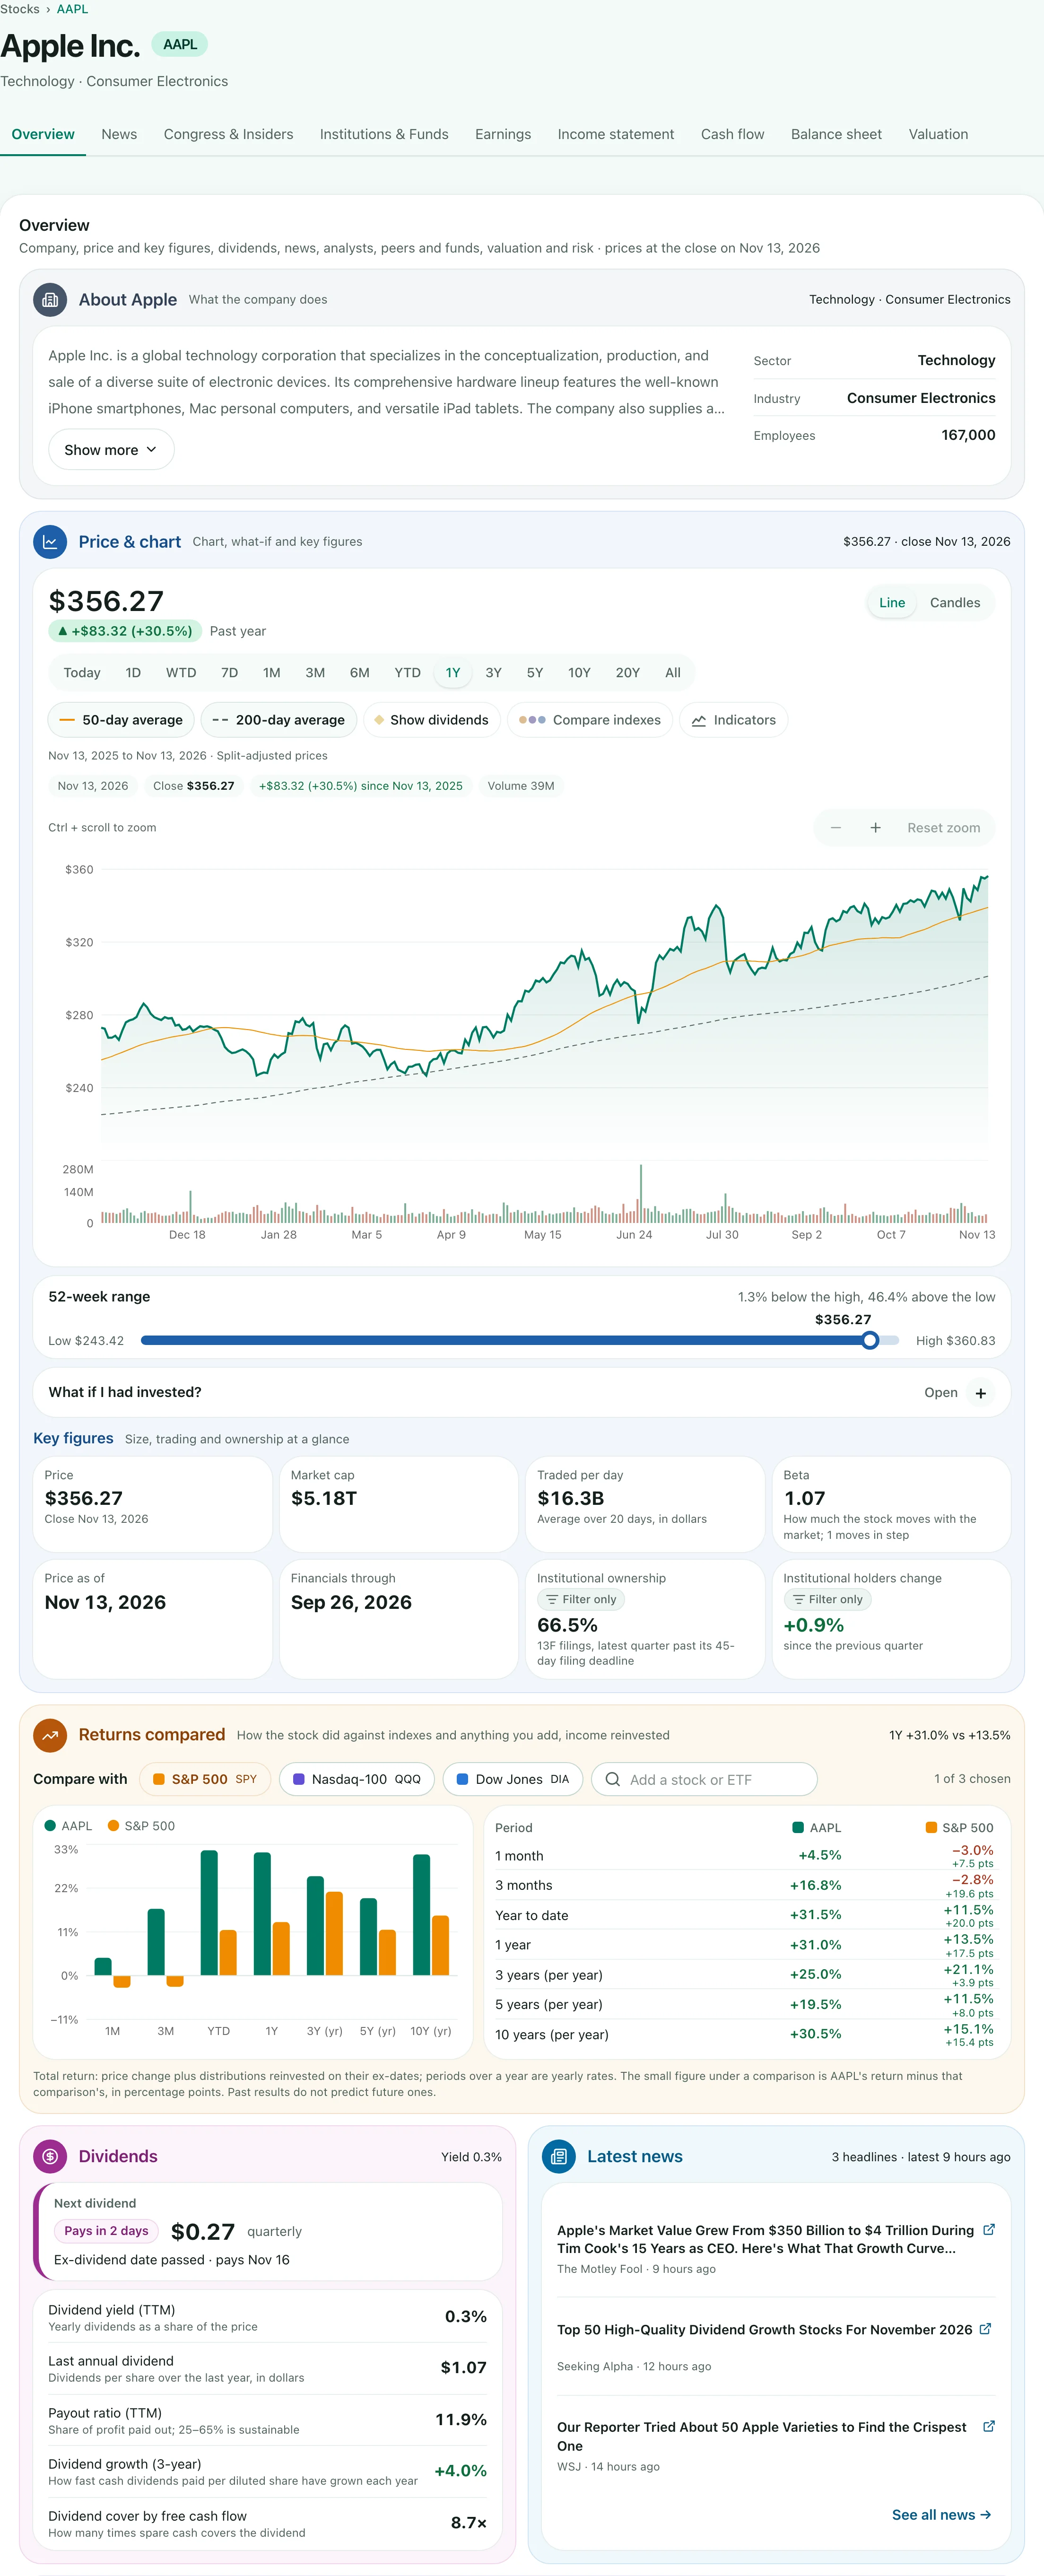
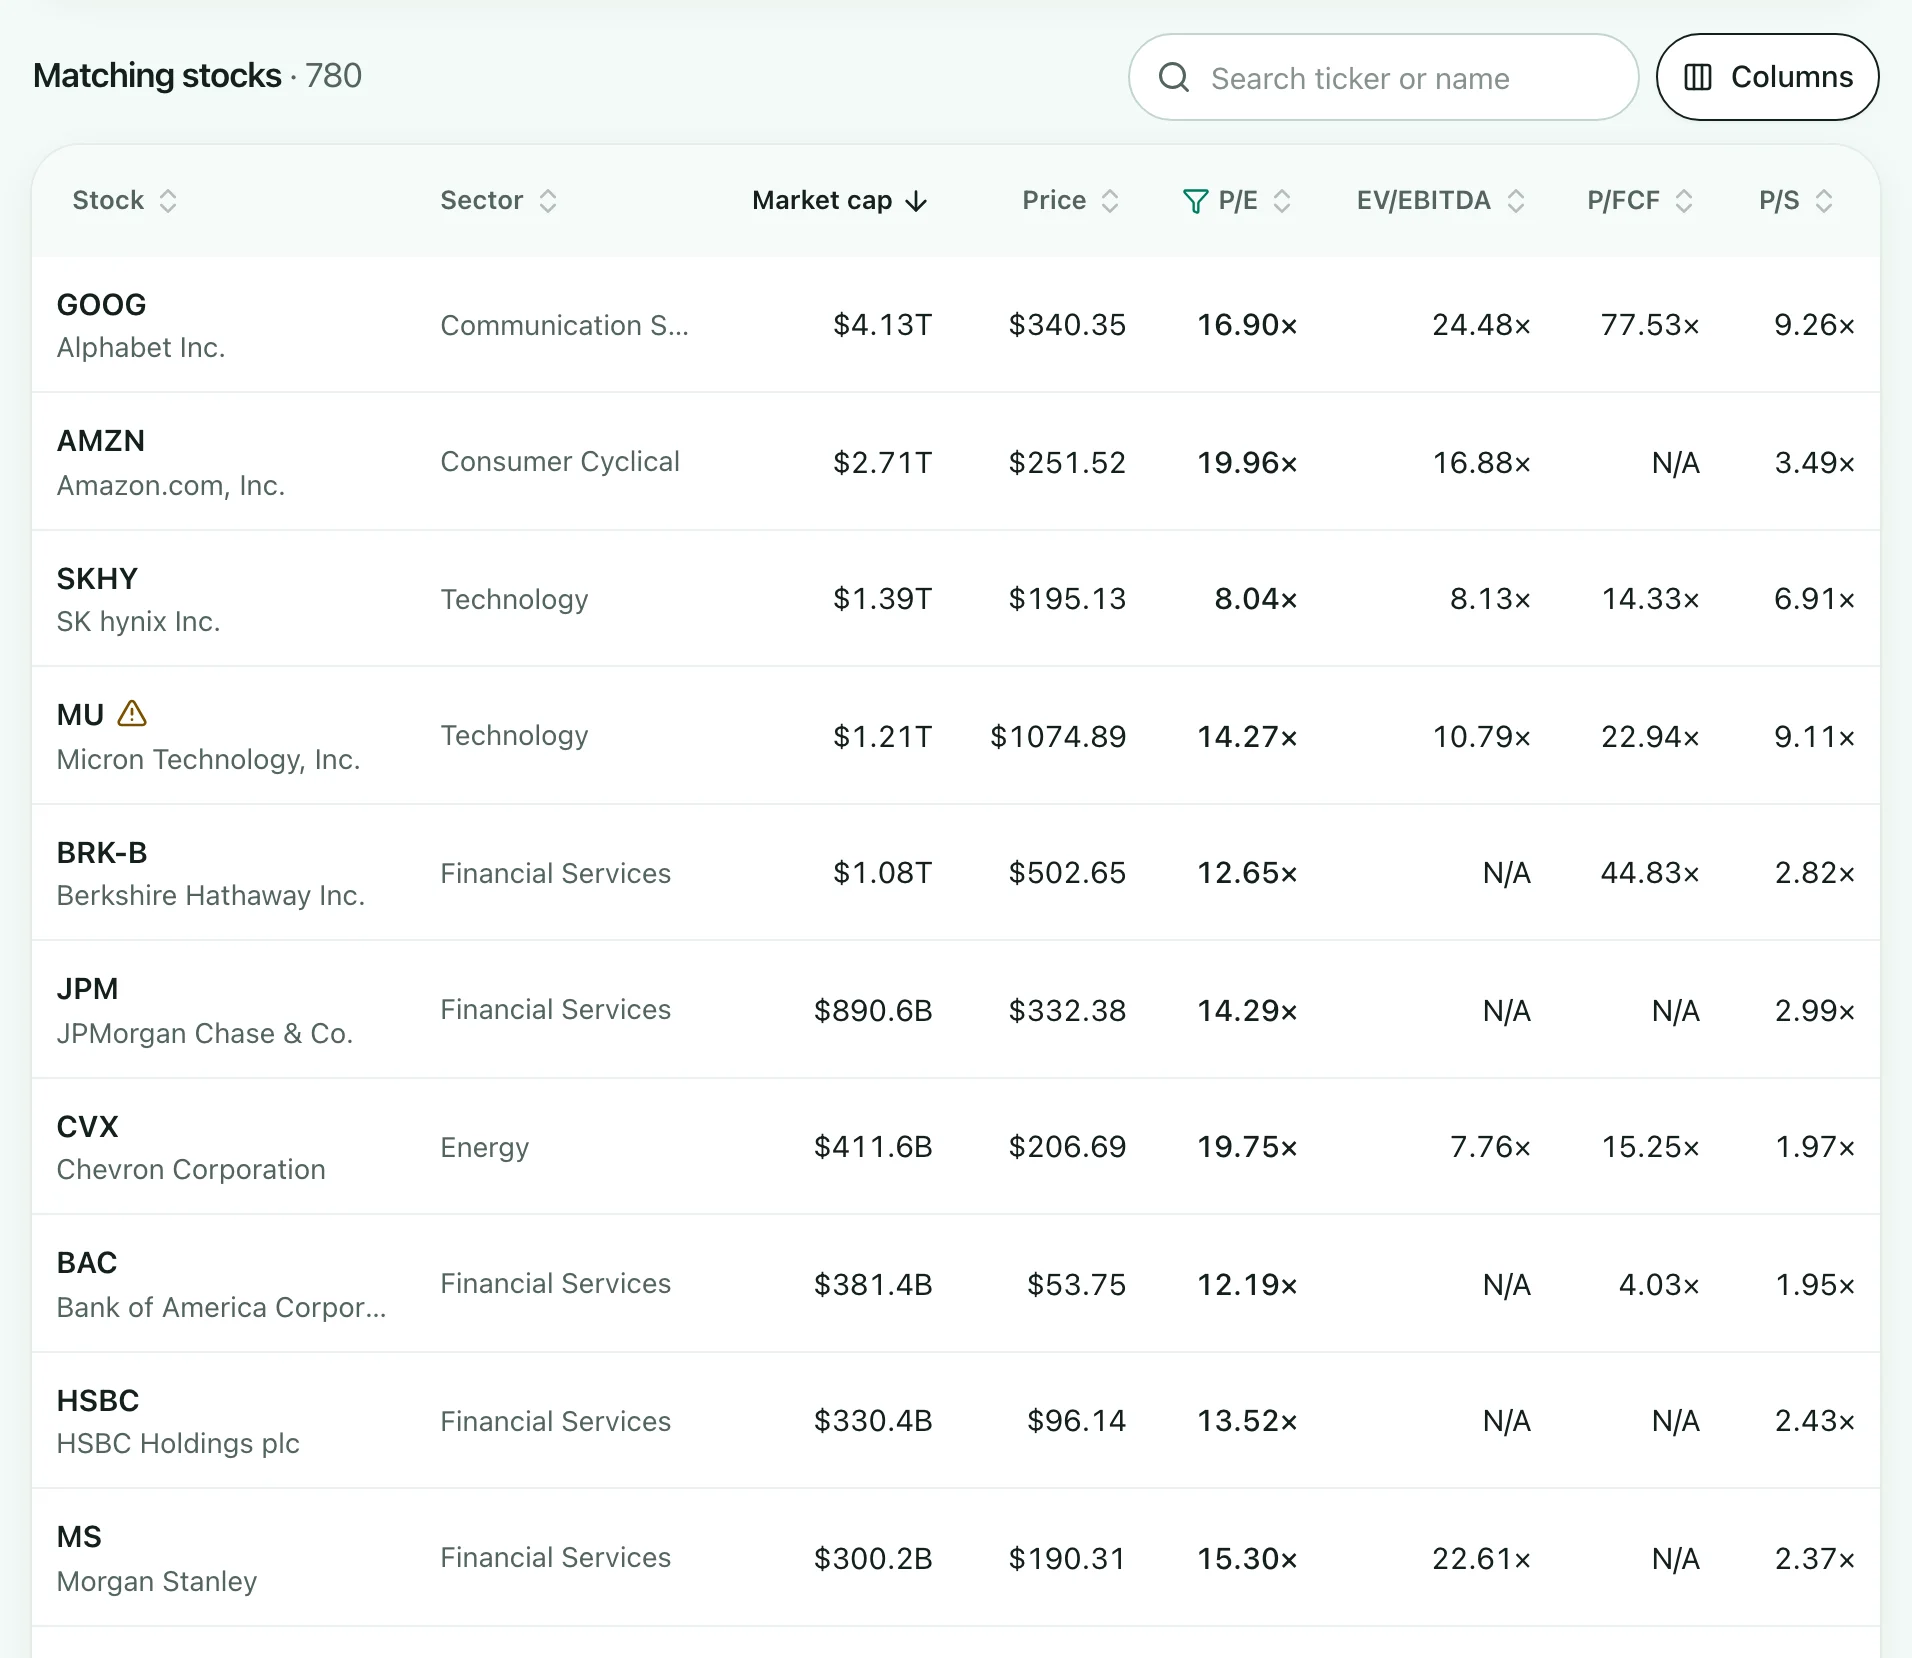
Every stock has its own page: up to 20 years of prices beside the S&P 500, income statements drawn as money in and out, EPS against estimates, a What-if look back, similar companies, the ETFs that hold it, its next dividend and the latest news.

Valuation history: how a stock's P/E, P/S, P/FCF, EV/EBITDA and P/B have moved over up to 20 years, for companies that report in US dollars. It opens on 10 years and sets today's multiple against the stock's own 5- and 10-year medians and range.

Chart indicators: moving averages, Bollinger Bands, Ichimoku, RSI, MACD and more, up to 8 overlays and 3 lower panels, off until you add them. Members' charts of dollar-priced US-listed stocks and ETFs open on Today (five-minute bars, where only VWAP and the volume average apply); choose 1M or longer for the rest, worked out on daily prices (weekly bars on 10Y and longer).

How the stock pages work
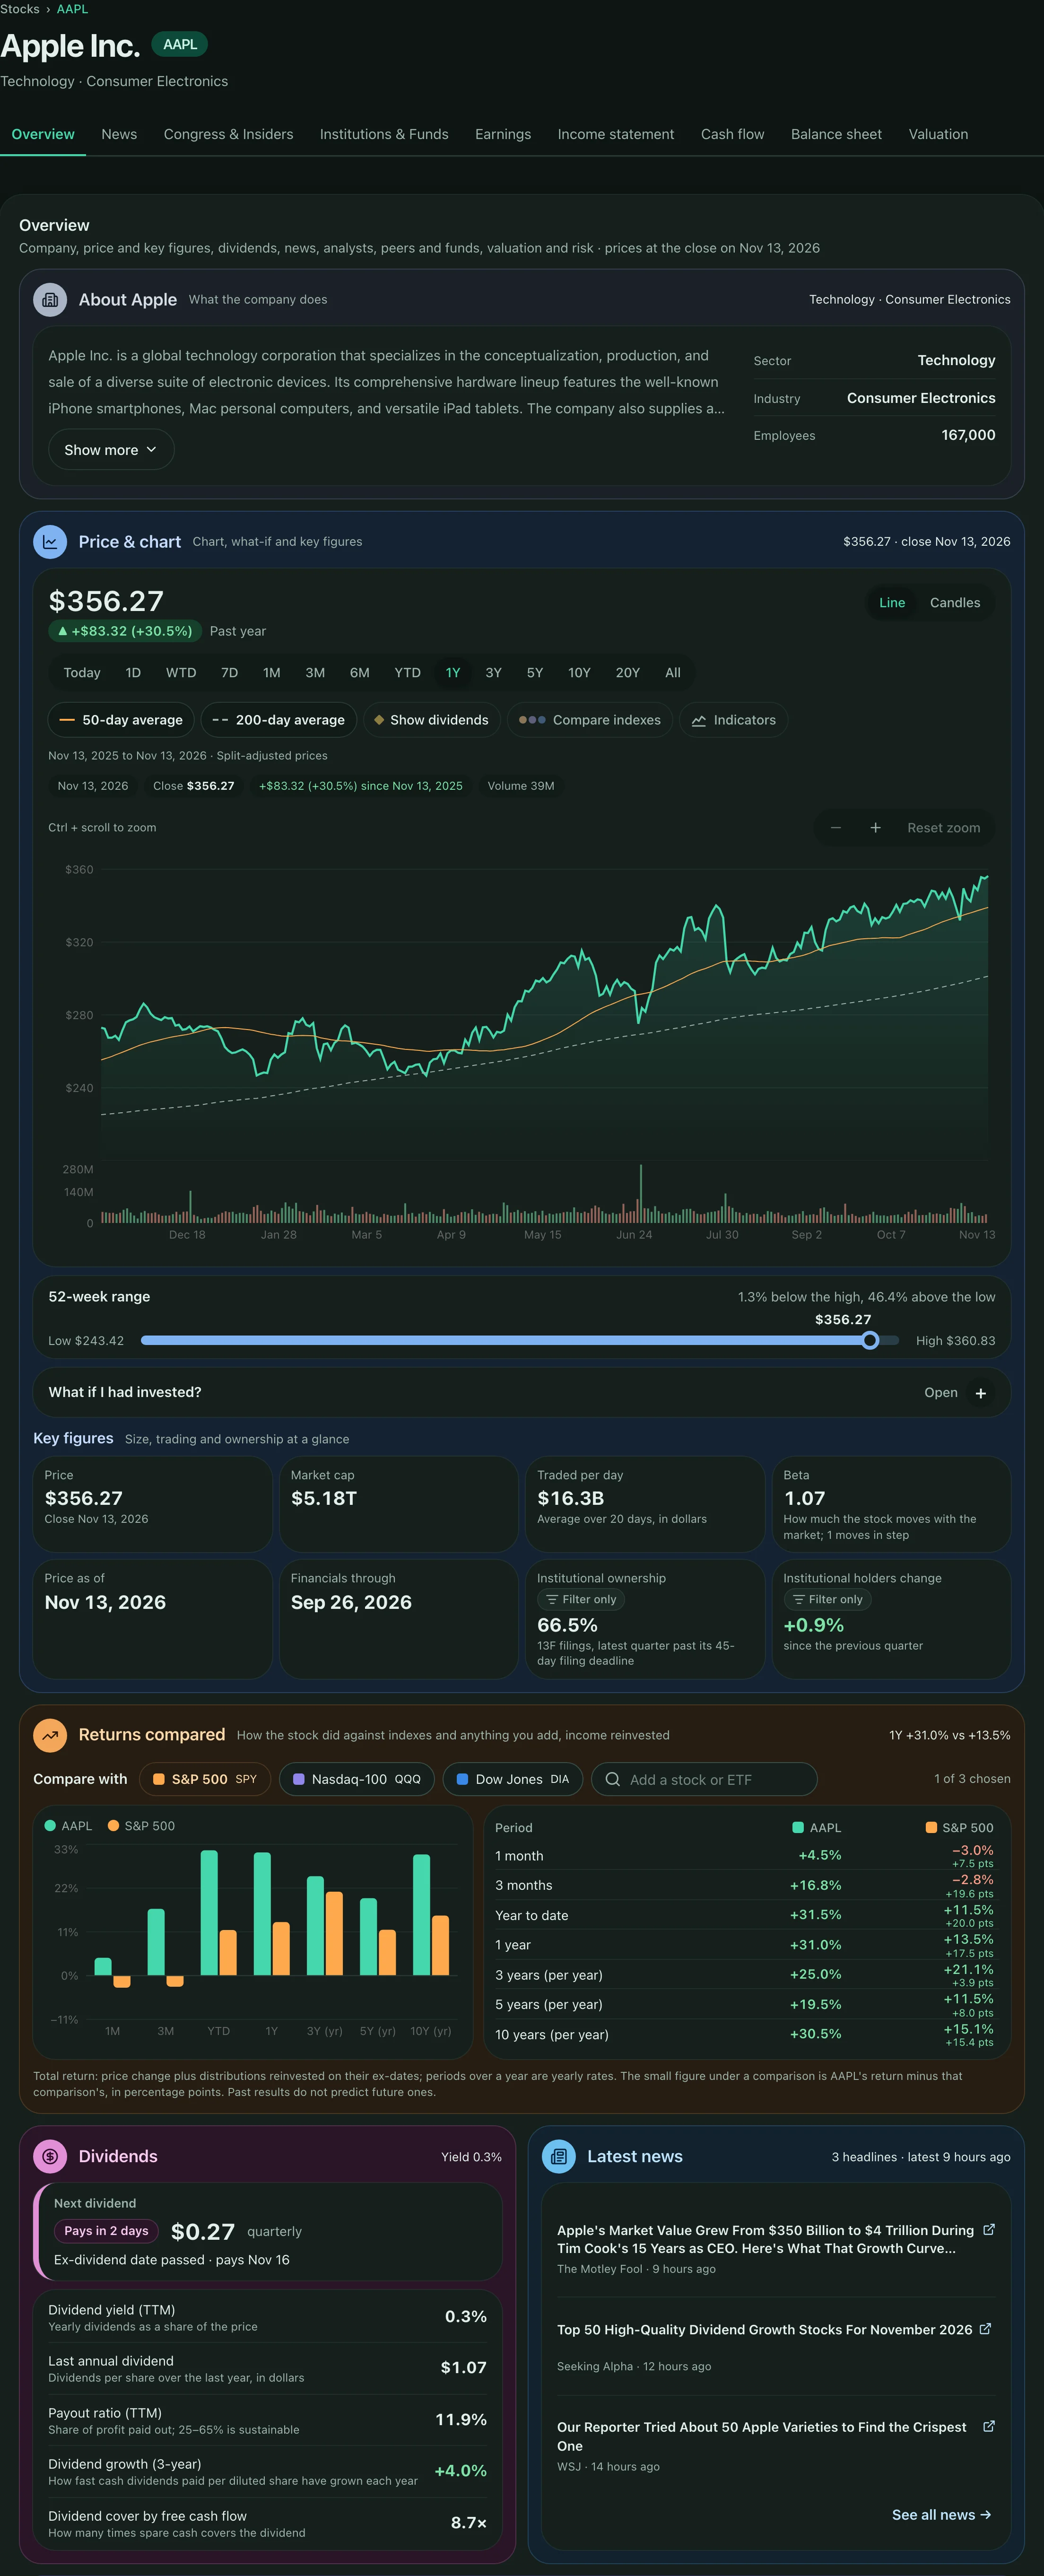
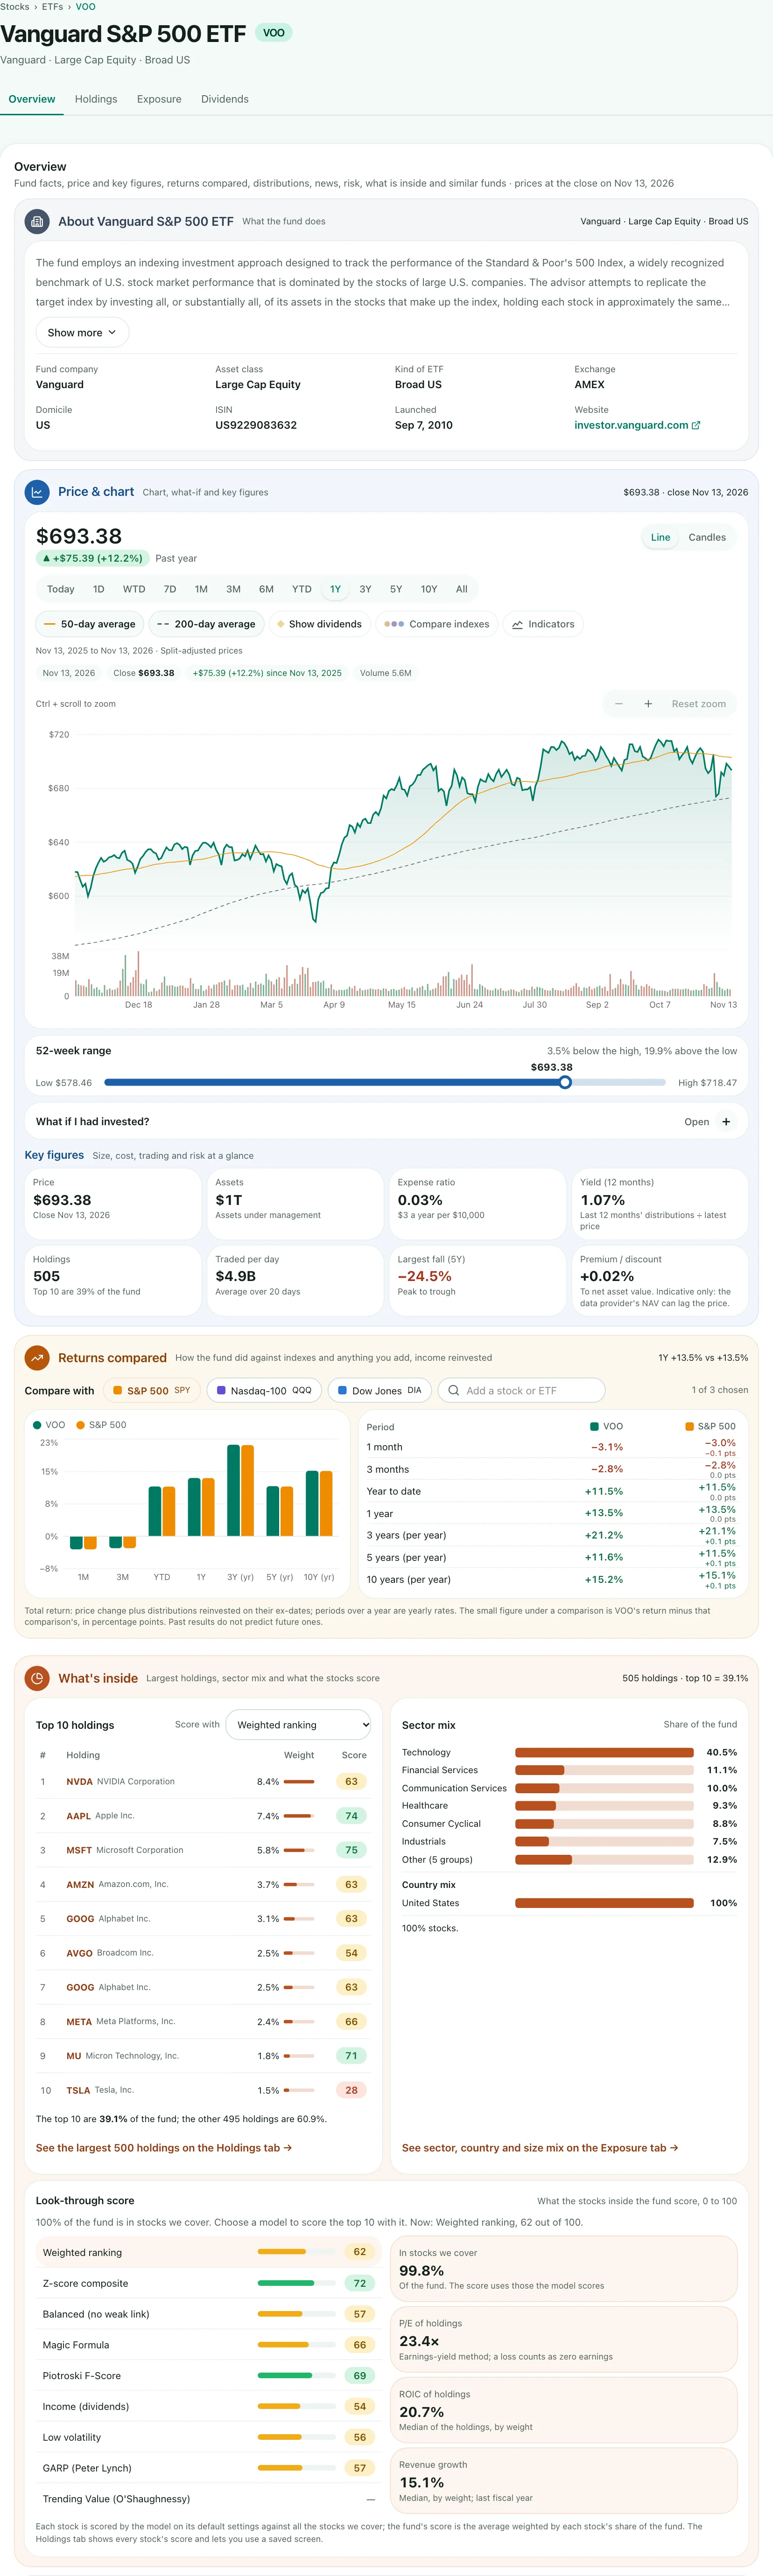
A stock's Overview: a price chart with the 52-week range, key figures, returns compared with the indexes, dividends and the latest news.

Also: market news on the app's home page, My lists of stocks and ETFs, saved screens, ⌘K search for any stock or ETF (Ctrl+K on Windows), and a layout that works on a phone, in light or dark mode. For research only, not investment advice. The Congress and insider trackers, Super Investors, Valuation history and the portfolio builder are for members.

The data

Built so you can check the numbers.

  • Checked against company filings

    Earnings per share and revenue are read from each company's own SEC earnings release and labelled Adjusted or GAAP, so a beat or a miss compares like with like.

  • Backtests without hindsight

    Each month ranks the 3,000 largest US common stocks of that date, including companies that later delisted, using only figures that were public at the time.

  • Every figure dated

    Each stock shows the date of its latest price and financials. Where a figure isn't available, the page says so instead of guessing.

  • Refreshed every weekday

    Scores, statements and trades update each evening after the US market closes. During the session, members see prices delayed by up to 10 minutes.

What's in the data
Stocks and ETFs
About 3,000 companies listed on the NYSE, Nasdaq, NYSE American or Cboe, the largest by market value down to roughly $400 million, one share class each, foreign companies listed in the US included; no preferred shares, warrants or SPACs. Plus about 2,000 of the largest US-listed ETFs, with prices, distributions and holdings.
Prices and financials
Up to 20 years of split-adjusted prices and dividends, plus the S&P 500, Nasdaq-100 and Dow Jones (through the SPY, QQQ and DIA funds) for comparison. Trailing twelve-month figures, and up to 20 years (or 80 quarters) of income statements, cash flow statements and balance sheets (fewer for recent listings), with revenue by business segment and region.
Earnings, analysts and calendars
Upcoming report dates with analysts' estimates, up to 20 years of past reports (actual against estimate; EPS is compared on the company's adjusted or GAAP basis, read from its earnings release, for about the last five years of reports from companies that file 8-Ks), consensus forecasts refreshed daily, and upcoming ex-dividend dates and IPOs.
Trades and holders
Insider purchases and sales (SEC Form 4) and Congress trades in the stocks we cover, 5 years back, plus institutional holders and about 50 well-known investors from quarterly 13F filings. Congress trades and 13F filings can arrive up to 45 days late.
Economy
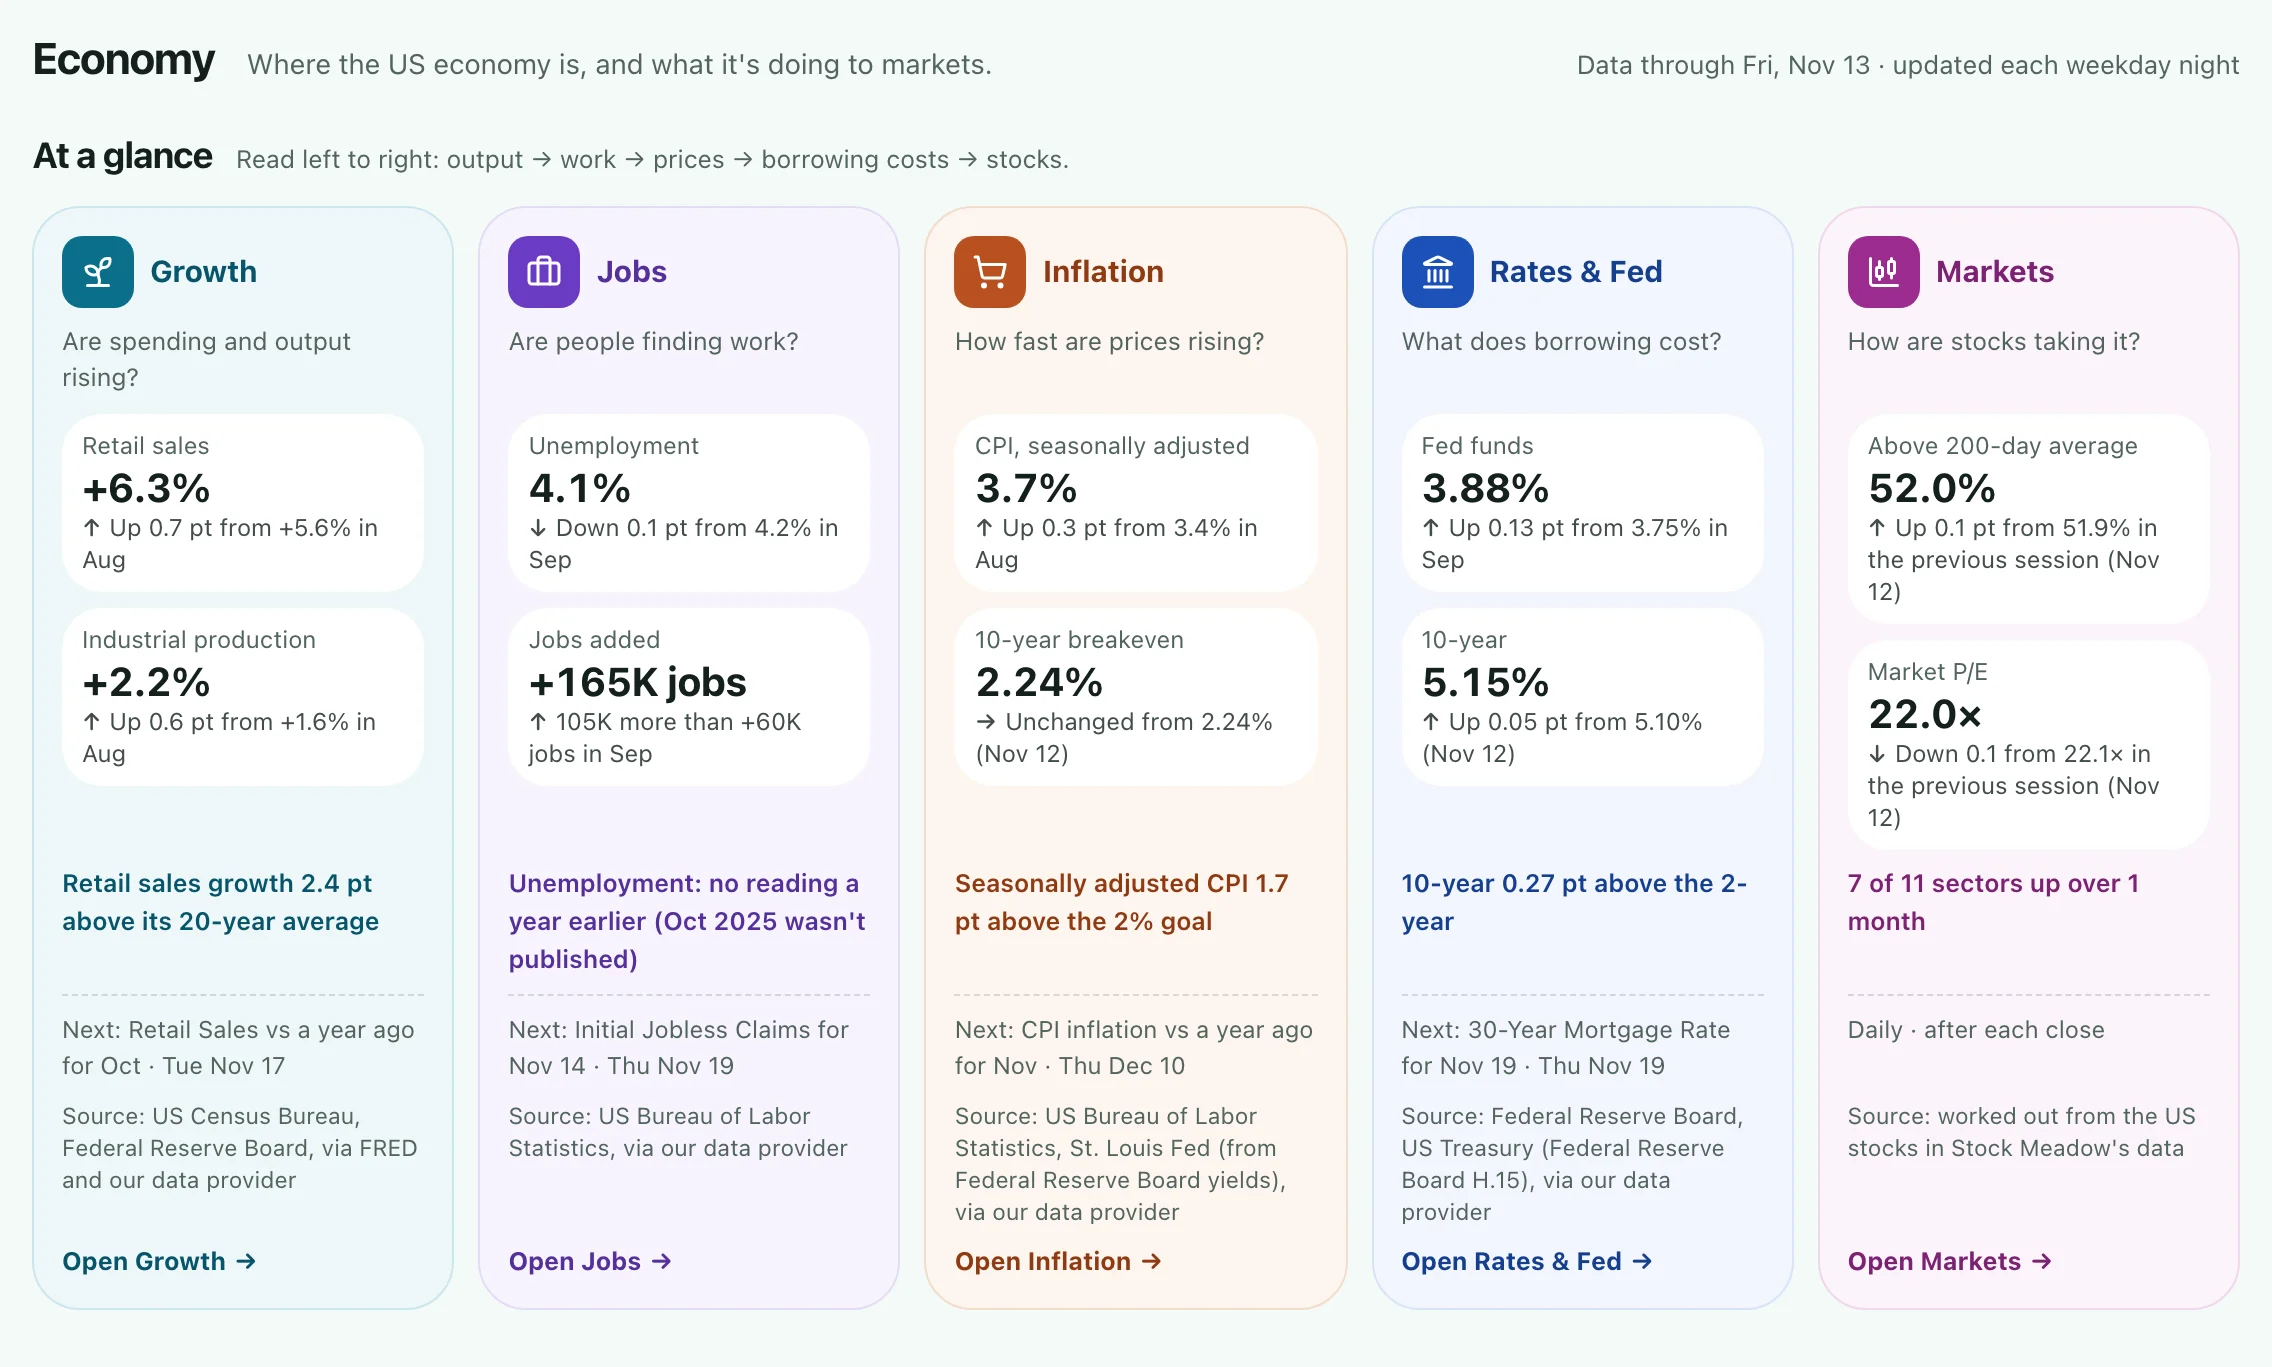
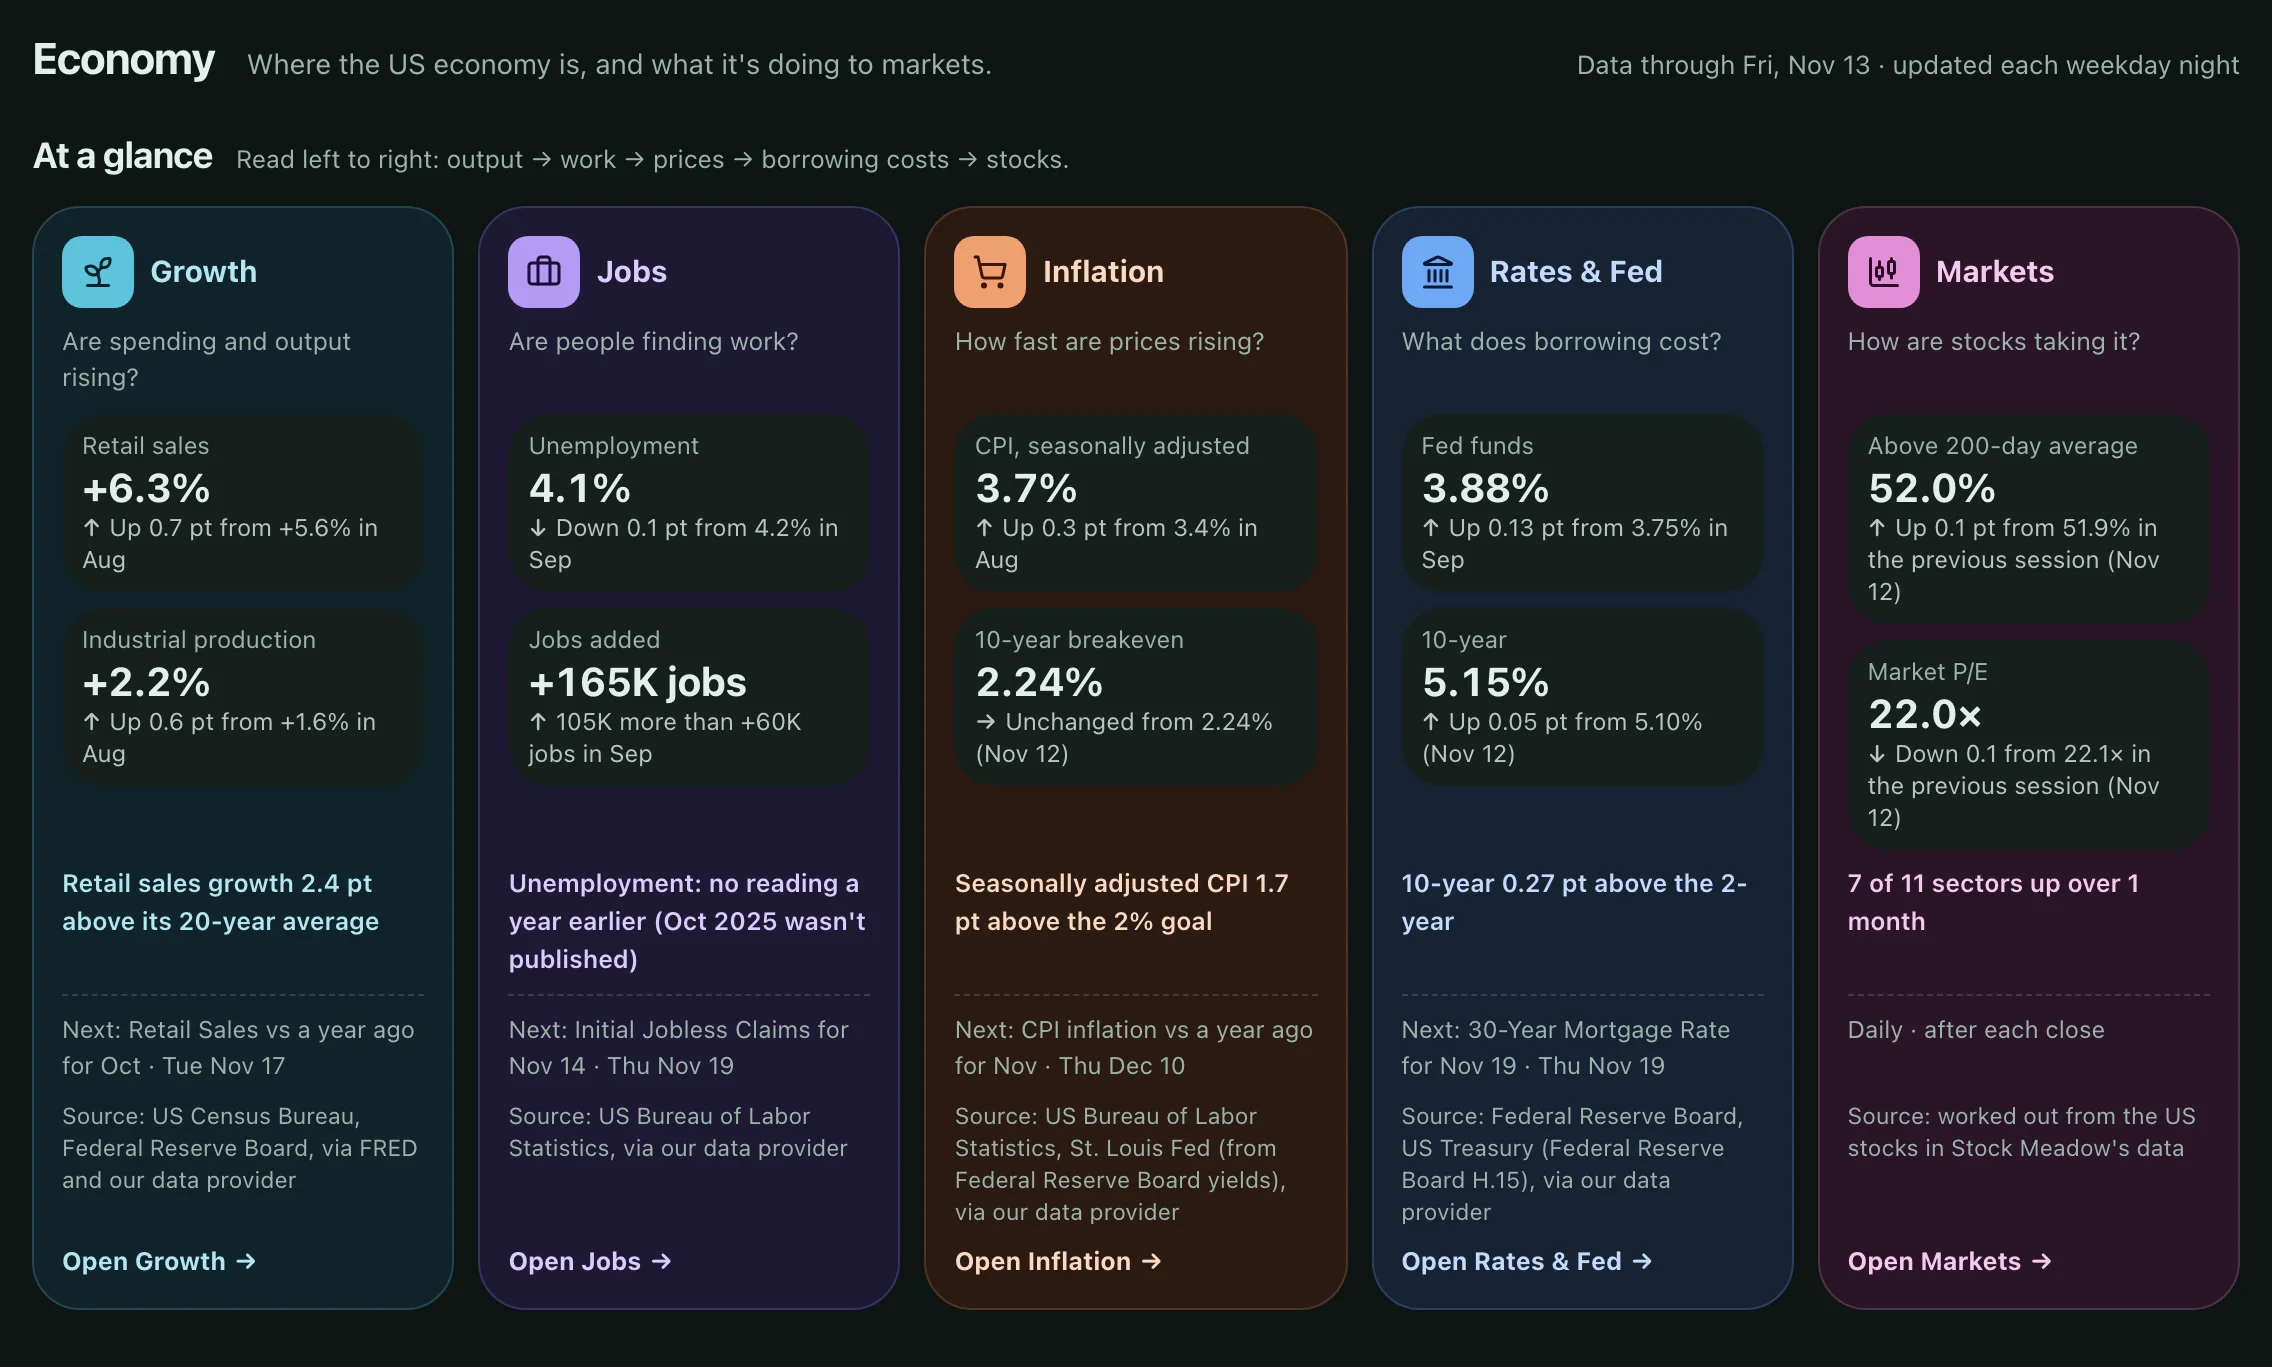
Growth, jobs, inflation, rates and the Fed, and how stocks are taking it, plus the US economic calendar, published by US agencies. Growth, jobs, inflation and rates go back up to 20 years; stock-market breadth and valuation history starts in October 2026.
Freshness
Updated every weekday evening after the US market closes: scores, metrics, financial statements, and insider and Congress trades. Super Investor portfolios update as each 13F is filed, and the all-institutions figures after each filing deadline. Every stock shows the date of its latest price and financials. During the session members also see prices delayed up to 10 minutes (on the Today chart, the home page's index tiles and My lists) and earnings results about every 5 minutes (economic figures about every 10); nothing streams in real time.

103 metrics (47 scorable) in 8 groups

  • Valuation7
  • Profitability5
  • Growth9
  • Financial health5
  • Dividends5
  • Price trend30
  • Company7
  • Statement figures35

Score or filter on most of them; a few, such as employees, can only be filtered on. The stock metrics glossary gives each one its formula, how to read it and common pitfalls.

Not included: real-time streaming prices (members see prices delayed up to 10 minutes), mutual funds, trading or brokerage, and buy or sell tips. Stock Meadow helps you find stocks to research; the decisions are yours. The user guide lists every source and calculation.

Pricing

One plan. Everything included.

No tiers and no add-ons. Try all of it free for 7 days before you decide.

Stock Meadow membership

$20a month

or $200 a year, which is 2 months free

Start your 7-day free trial
  • 7-day free trial with full access
  • No card needed to start
  • Cancel any time online

What you get

  • 9 scoring models and 103 metrics
  • AI search: ask for stocks in plain words (Beta)
  • Model backtests from 2006
  • Stock and ETF screeners, with saved screens
  • Congress and insider trackers
  • Super Investor portfolios and institutional holders
  • A page for every stock and ETF, with up to 20 years of history
  • Portfolio builder and optimizer
  • Earnings, dividend, IPO and economic calendars
  • Economy page and valuation history
  • Chart indicators and My lists

New accounts get a 7-day free trial, then $20 a month. Renews automatically at $20/month (or $200/year) until you cancel. Cancel anytime online; no refunds. Paid subscriptions are sold only to customers with a billing address in the United States (including Puerto Rico and the other US territories) or Canada. Anyone can create a free account and use the free trial and preview; only subscribing needs a billing address there. See pricing

Good to know

Does it cost anything?
New accounts get a 7-day free trial with full access, no card needed. After that it's $20 a month or $200 a year, and you can cancel any time. Paid subscriptions are sold only to customers with a billing address in the United States (including Puerto Rico and the other US territories) or Canada. Anyone can create a free account and use the free trial and preview; only subscribing needs a billing address there. See pricing.
How do I sign up?
Press the sign-up button on this page and enter your first name, last name and email. We email you a link straight away to set your password; setting it signs you in and starts your 7-day free trial. After that you sign in with your email address and password. If you ever forget it, we can email you a sign-in code or a reset link.
Who is Stock Meadow for?
Individual investors who want a shortlist of stocks and ETFs to research, ranked by rules they chose and can see.
What are stock scoring models?
A scoring model turns a few company figures, such as valuation, profitability, growth and debt, into one score from 0 to 100 for every stock, so you can rank thousands of stocks in seconds. Stock Meadow has 9: Weighted ranking, Z-score composite, Balanced (no weak link), Magic Formula, Piotroski F-Score, Income (dividends), Low volatility, GARP (Peter Lynch), Trending Value (O'Shaughnessy). The user guide explains every model and metric in plain language.
What is AI search?
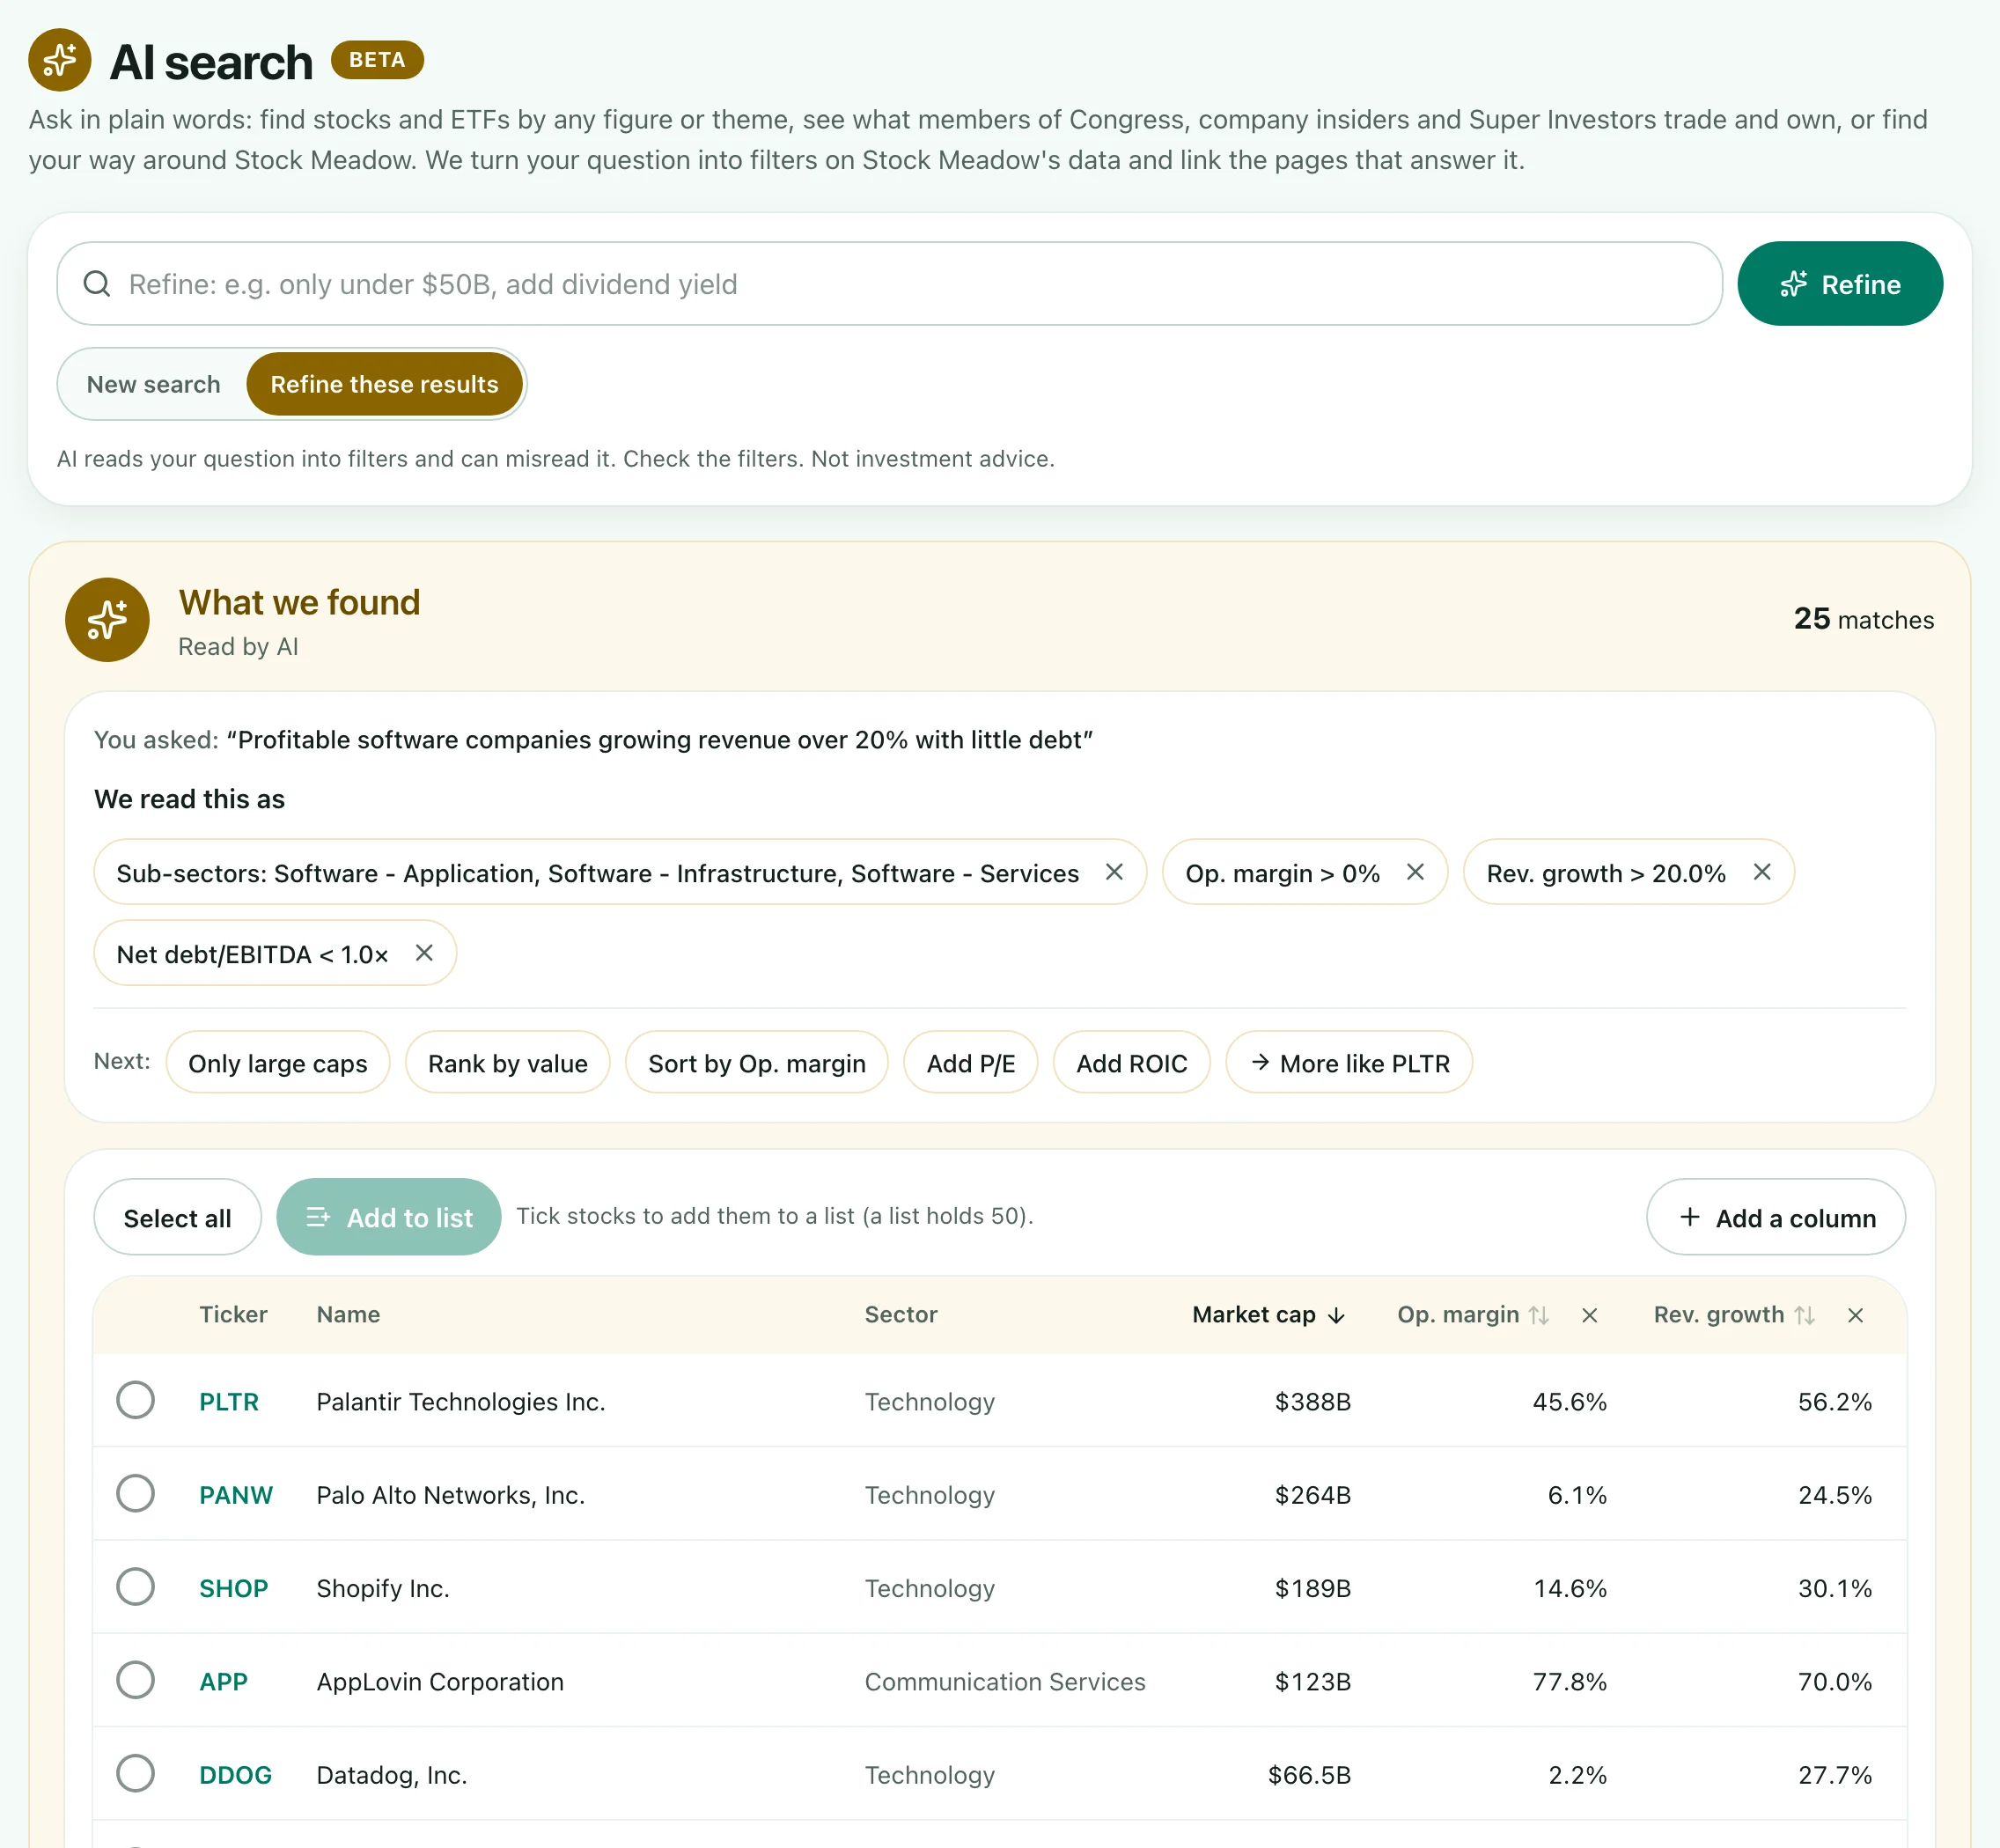
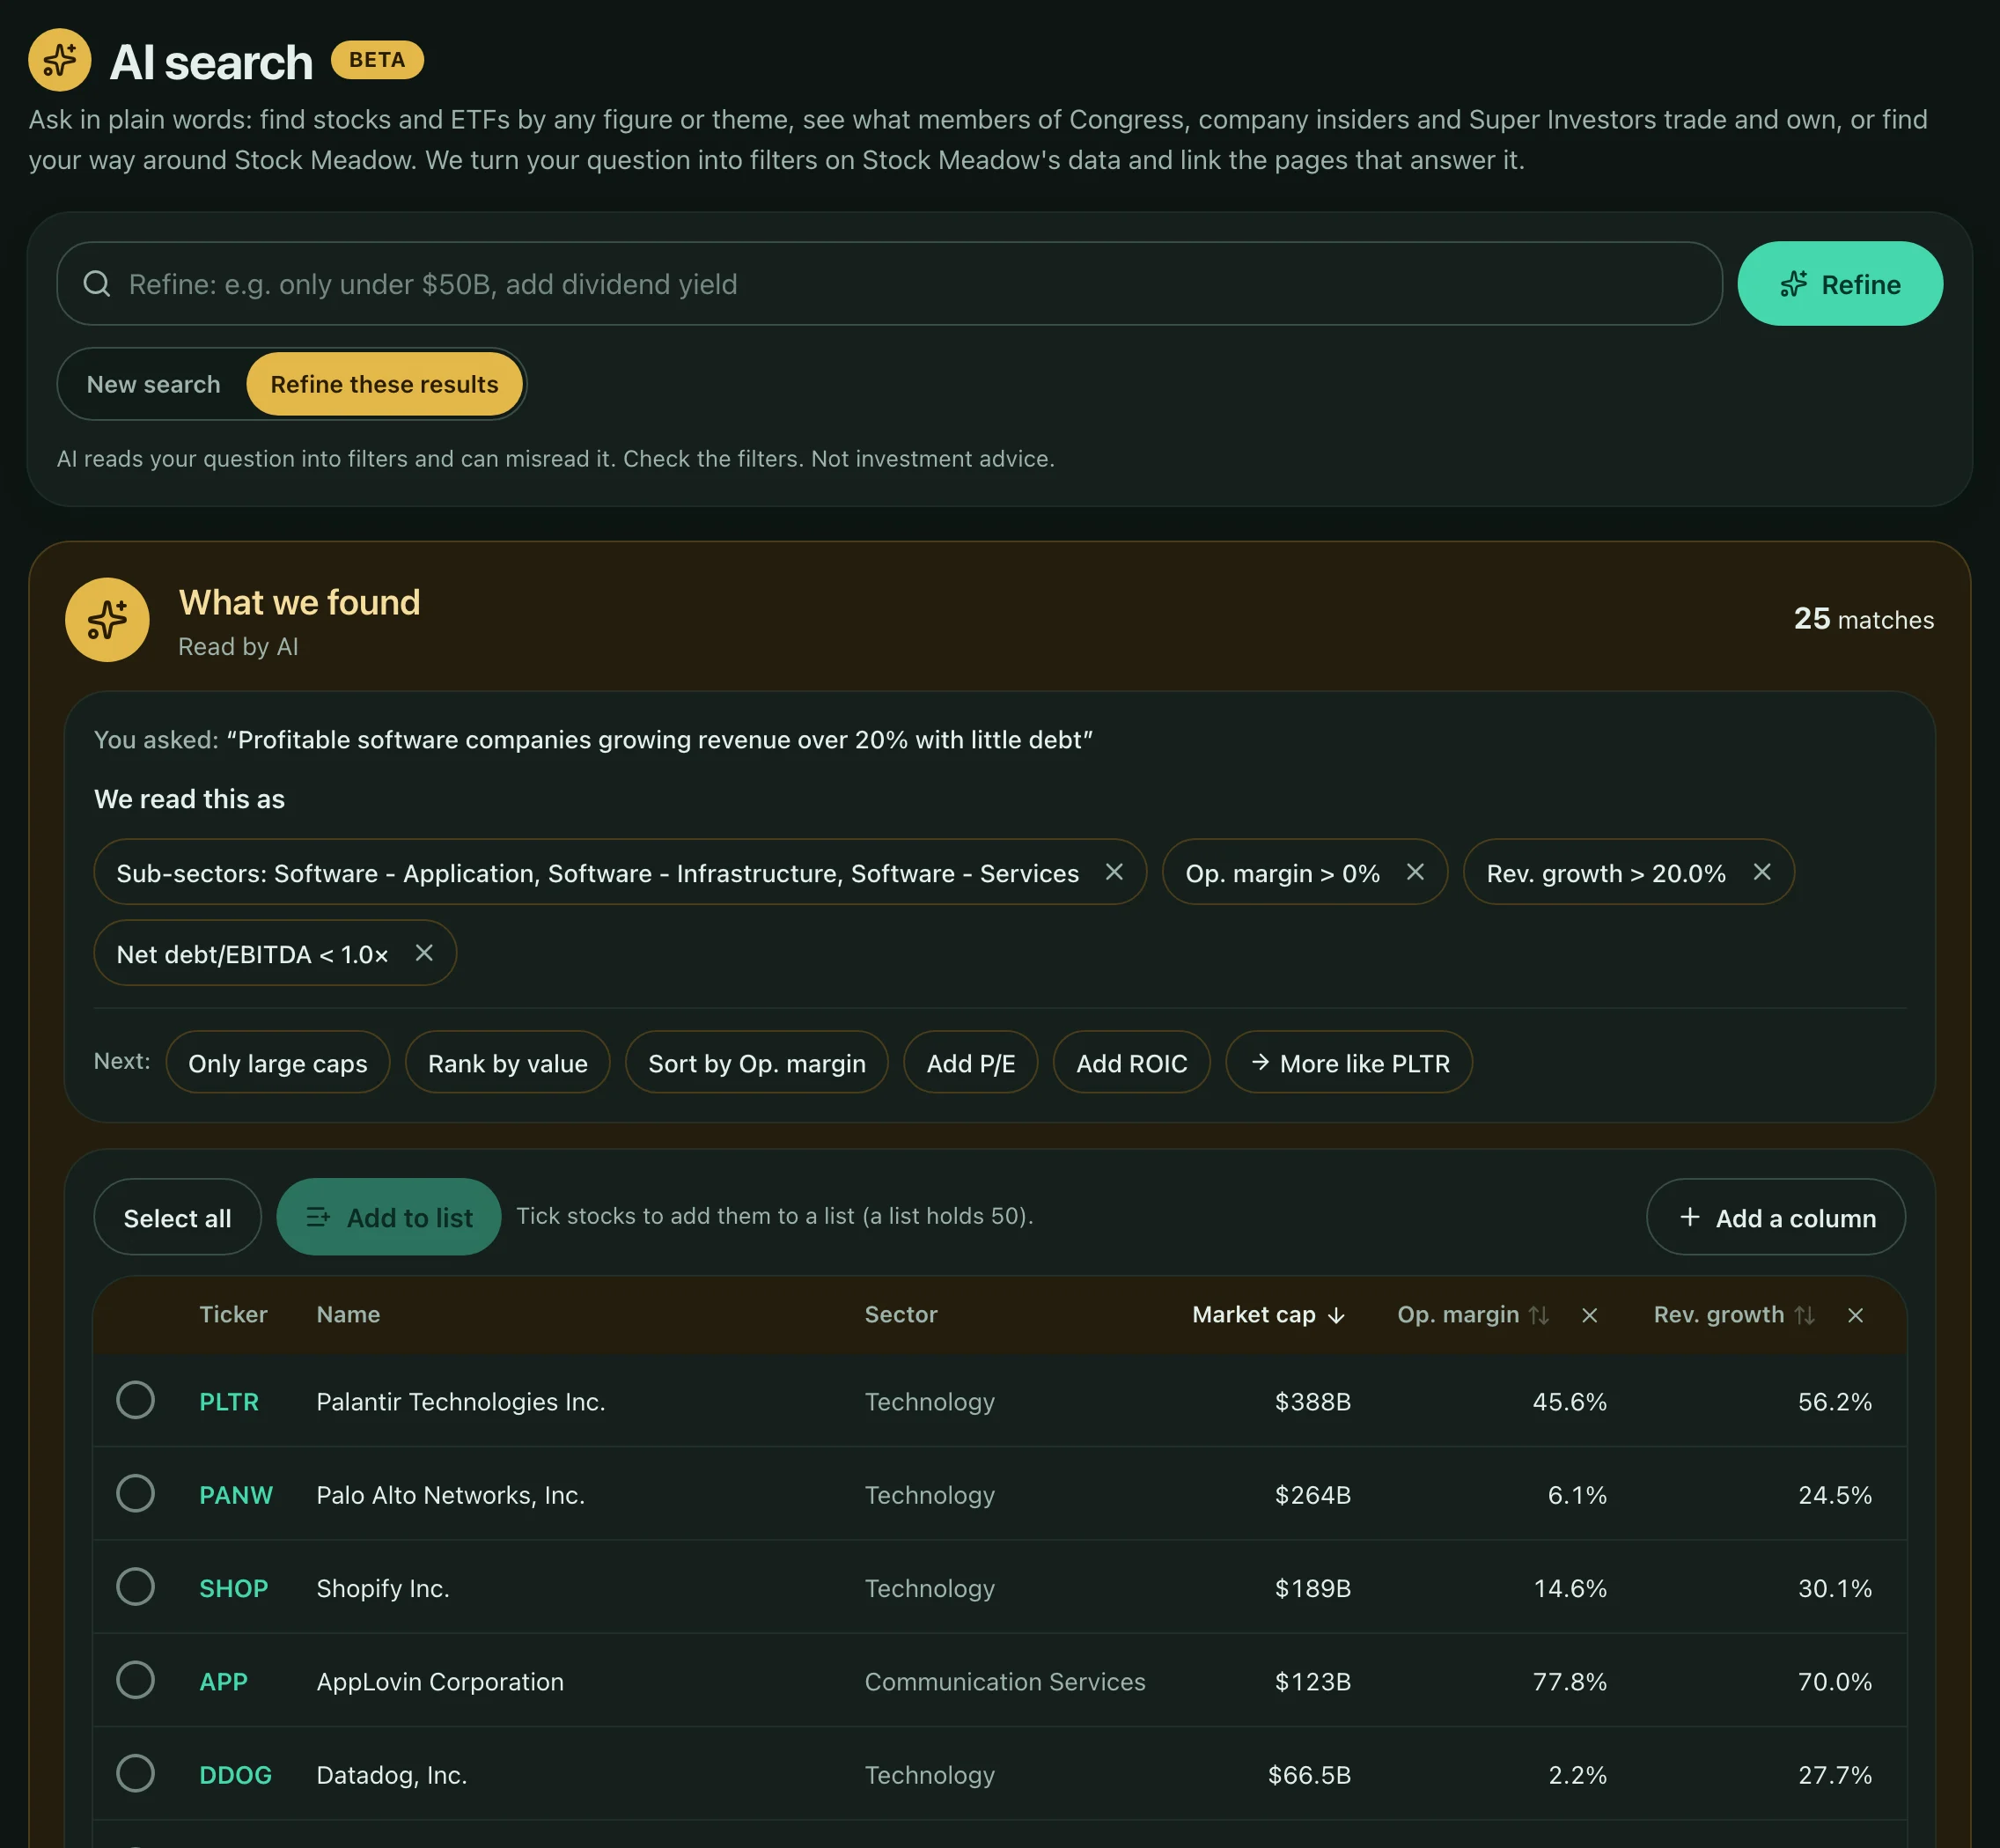
AI search (in Beta) lets you ask for stocks in plain words, such as "Profitable software companies growing revenue over 20% with little debt" or "Stocks Warren Buffett owns". It turns the question into filters on Stock Meadow's own data, shows exactly how it read the question (each filter is a chip you can remove), and lists the matching stocks with their figures. Ask about any metric, themes, Congress and insider trades, Super Investors, earnings and dividend dates, ETFs ("low-fee bond ETFs") or the people behind the trades ("who is the most active trader in Congress"); refine the results with a follow-up and add them to a list. The AI only reads your question: every figure comes from Stock Meadow's data, and themes are matched in company descriptions and in tags the AI has added, labelled as such. It can misread a question, so check the filters. It doesn't recommend stocks, and it is for members, with a daily limit on the searches the AI reads.
Can I backtest a scoring model?
Yes. The scoring-model backtest ranks the 3,000 largest US common stocks at each date from 2006 onward, including companies that later delisted, using only financial information public at the time. Choose the number of holdings, rebalance schedule and trading cost, then compare a hypothetical portfolio with the S&P 500, Nasdaq-100, Dow Jones or up to three stocks or ETFs. It reports year-by-year returns, holdings, drawdowns and recovery. Some metrics cannot be reconstructed historically and are excluded; the backtest lists unsupported inputs. Results are simulated, depend on the assumptions and data, and do not predict future results.
Show all 19 questions
Does it cover ETFs?
Yes. Stock Meadow covers about 2,000 of the largest US-listed ETFs, with lists, a screener and a page for each fund: price history, returns next to the S&P 500, risk, fees and yield, holdings, how the fund is spread, and a look-through score, the average score of the stocks it holds weighted by their share of the fund (shown when at least a fifth of the fund is in stocks we score). Mutual funds are not included, and an ETF's score describes the stocks inside it, not the fund's price or future returns.
Can I track what Congress is buying and selling?
Yes. The Congressional Trade Tracker lists the stock purchases and sales disclosed by members of the US Senate and House in the stocks Stock Meadow covers (about 3,000 US-listed companies), with 5 years of history. Trades in other stocks, and in bonds, options and funds, are not included. Switch between the last 30 days, 90 days, 1 year and 5 years, counted from the day each report was filed, to see buys against sells, the most bought and sold stocks, the most active members and the most traded stocks, and search for any member or stock. Disclosures can be filed up to 45 days after a trade, amounts are reported as ranges, so the tracker counts trades, and the tracker is for members.
Does it show insider trades, analyst estimates and institutional holders?
Yes. Each stock's Congress & Insiders tab charts 5 years of open-market insider purchases and sales and of trades by members of Congress, and the Insider tracker covers all the stocks we cover at once. A stock's Analysts card shows consensus EPS and revenue forecasts, expected growth, estimate revisions and how many analysts cover it, its Institutions tab shows who owns it from quarterly 13F filings, and the earnings calendar lists upcoming reports with analysts' estimates.
Can I see what well-known investors own?
Yes. The Super Investors page shows the quarterly 13F portfolios of about 50 well-known investors, with five years of quarters: their holdings, what they added, reduced or sold, and the stocks most of them own. Each stock's Institutions tab shows which of them own it. A 13F covers only long positions in US stocks (no shorts, cash, bonds or most foreign shares) and is filed up to 45 days after each quarter ends. A new quarter appears as soon as an investor files it, so for a few weeks the page can mix investors on different quarters; it says how many have filed the newest one.
What does the portfolio builder do?
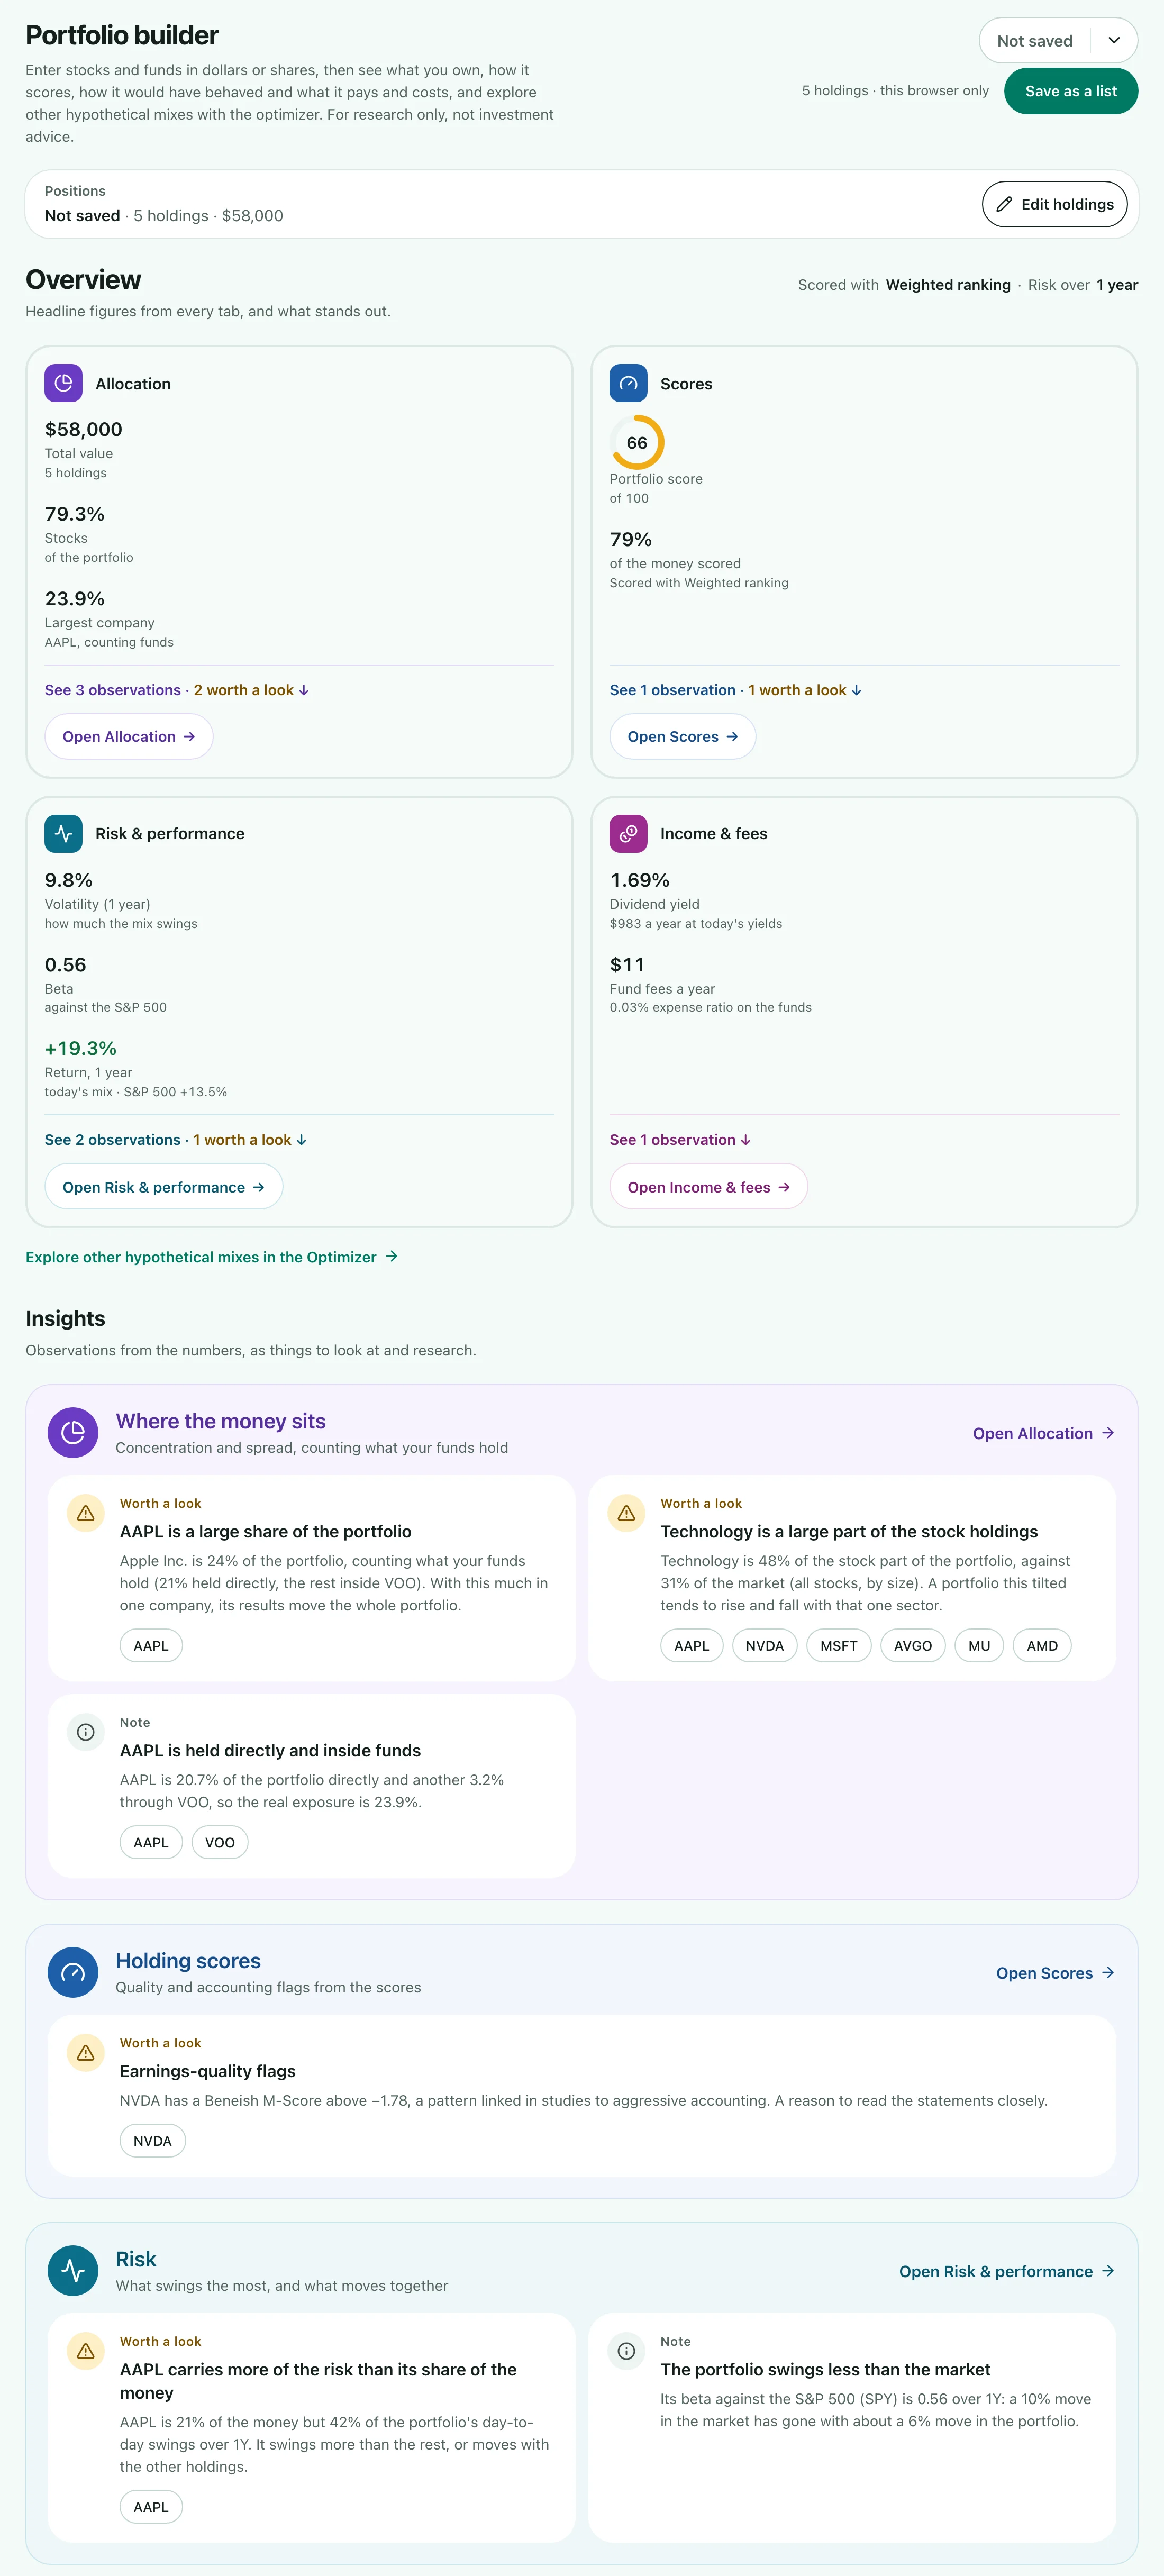
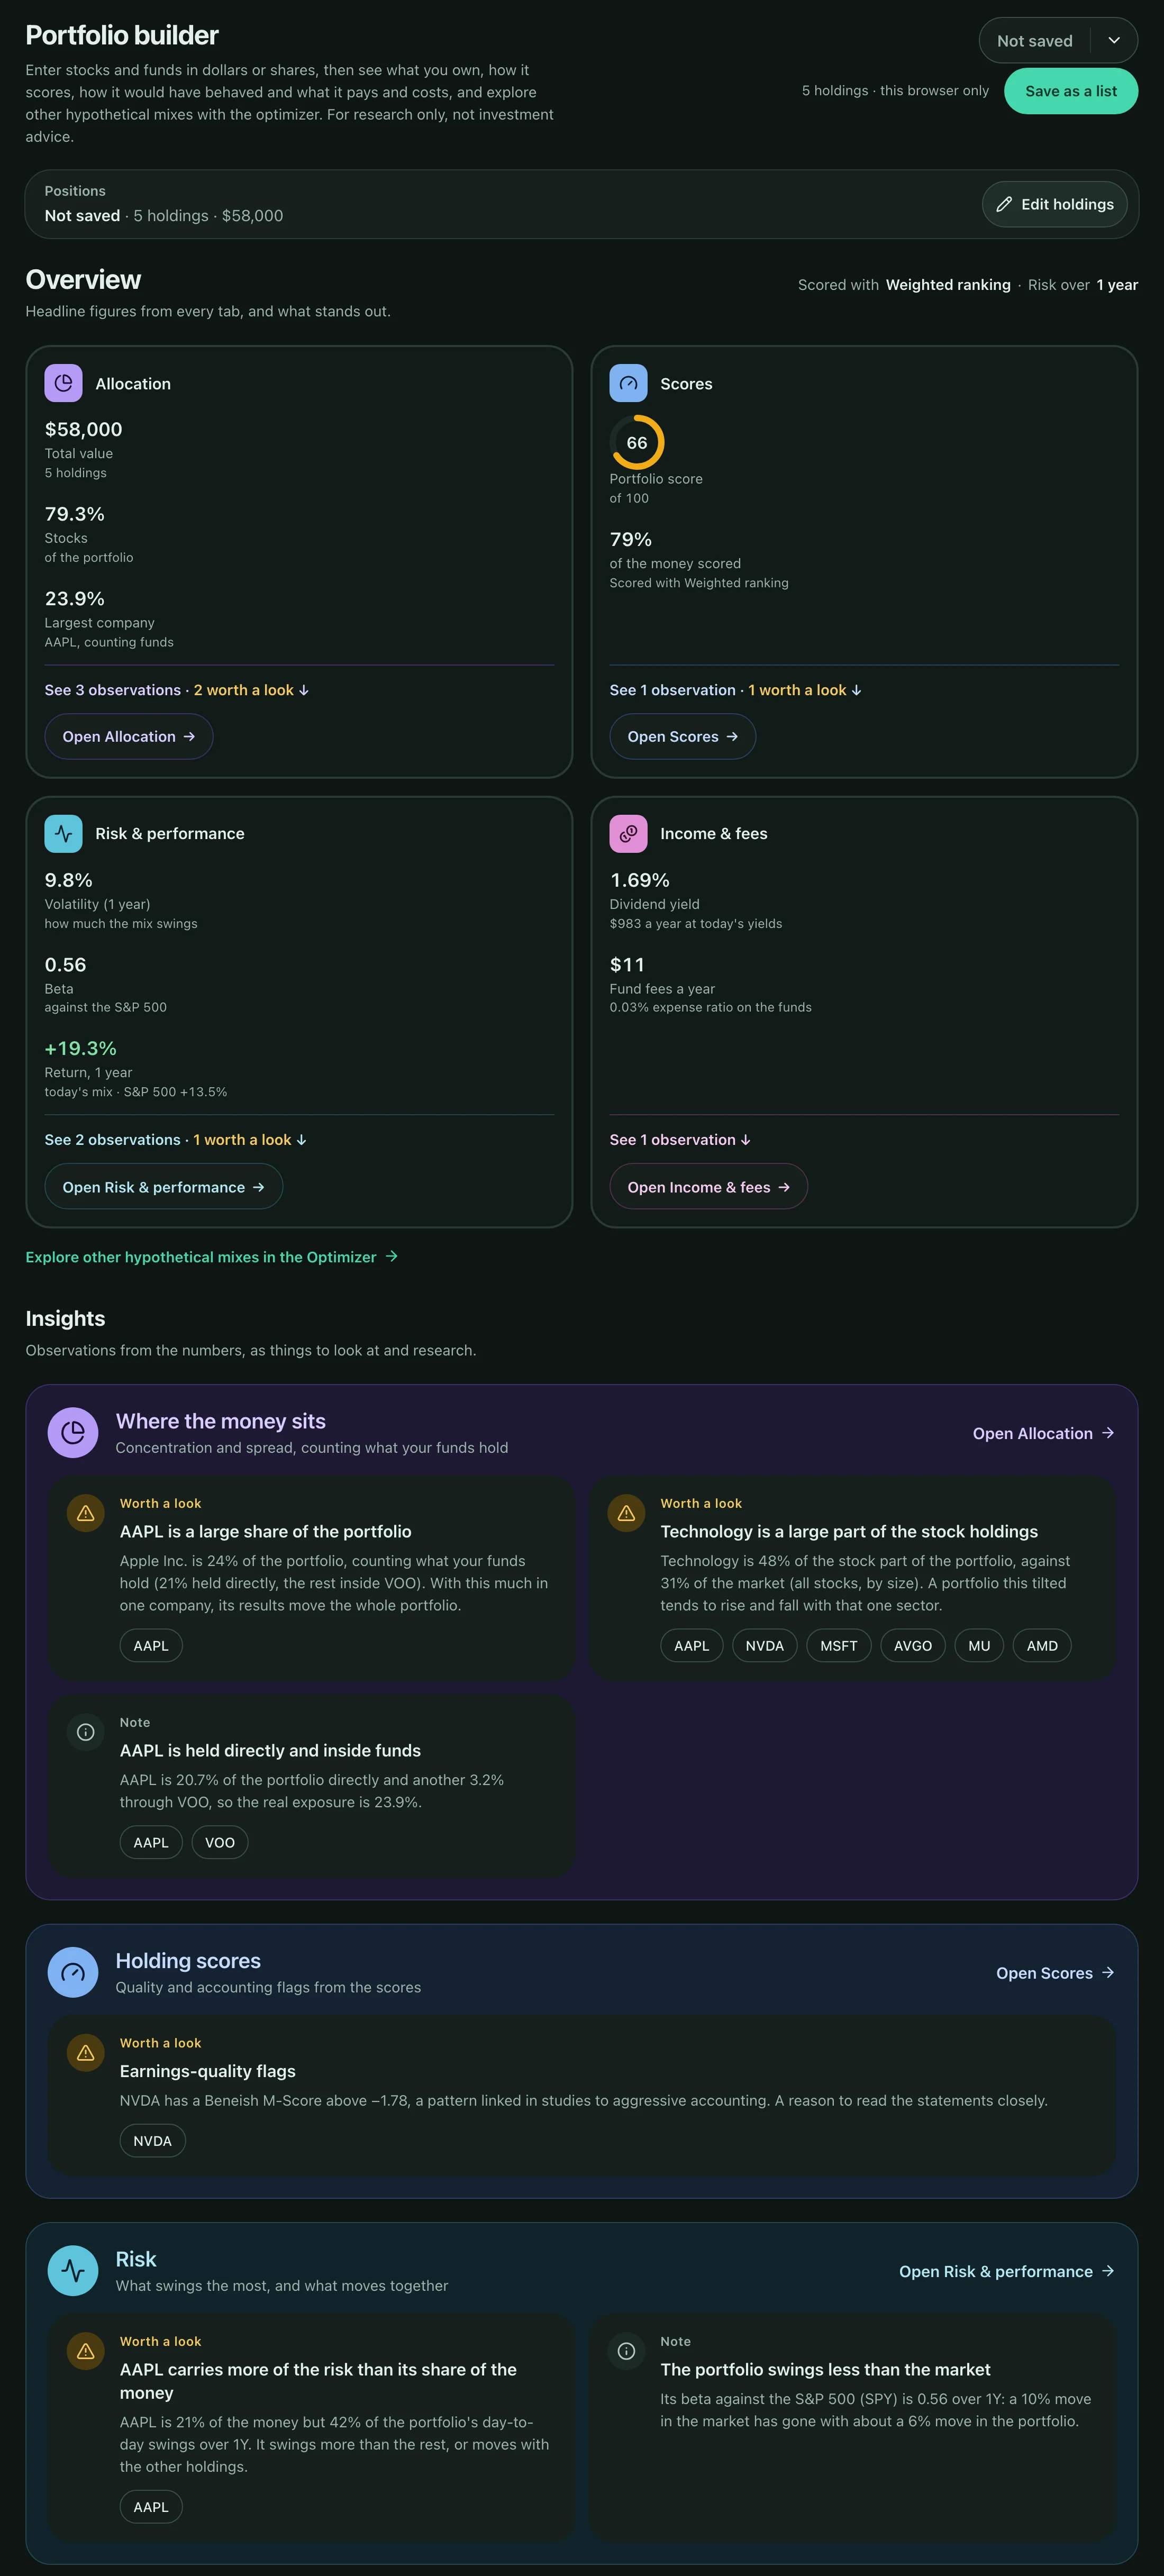
Enter the stocks and ETFs you hold or are considering, in dollars or shares (save them in My lists: up to 50 lists of up to 50 entries; a list with amounts is analyzed as a portfolio, one without is a watchlist you can score), and it shows what you own with funds looked through, how it is spread by asset class, country, sector and company size, how the holdings score, how the mix would have behaved over time, and the income and fees. An optimizer then shows hypothetical mixes of those same holdings on an efficient frontier, for goals such as lowest volatility or highest Sharpe ratio, from past returns or from market-implied returns adjusted by views you state; it is a way to explore trade-offs under stated assumptions, not advice. It isn't connected to a brokerage account, and its insights are observations to research, never advice to buy or sell. It is for members.
Is there economic data?
Yes. The Economy page covers growth, jobs, inflation, and rates and the Fed, each with up to 20 years of history, plus how stocks are taking it (breadth, valuation, sectors) and the US economic calendar tagged by chapter. The breadth and valuation history starts in October 2026 and builds up daily. A summary of the latest readings, the yield curve and the calendar is public; members get the history charts. It is information only, not advice.
Are there earnings, dividend, IPO and economic calendars?
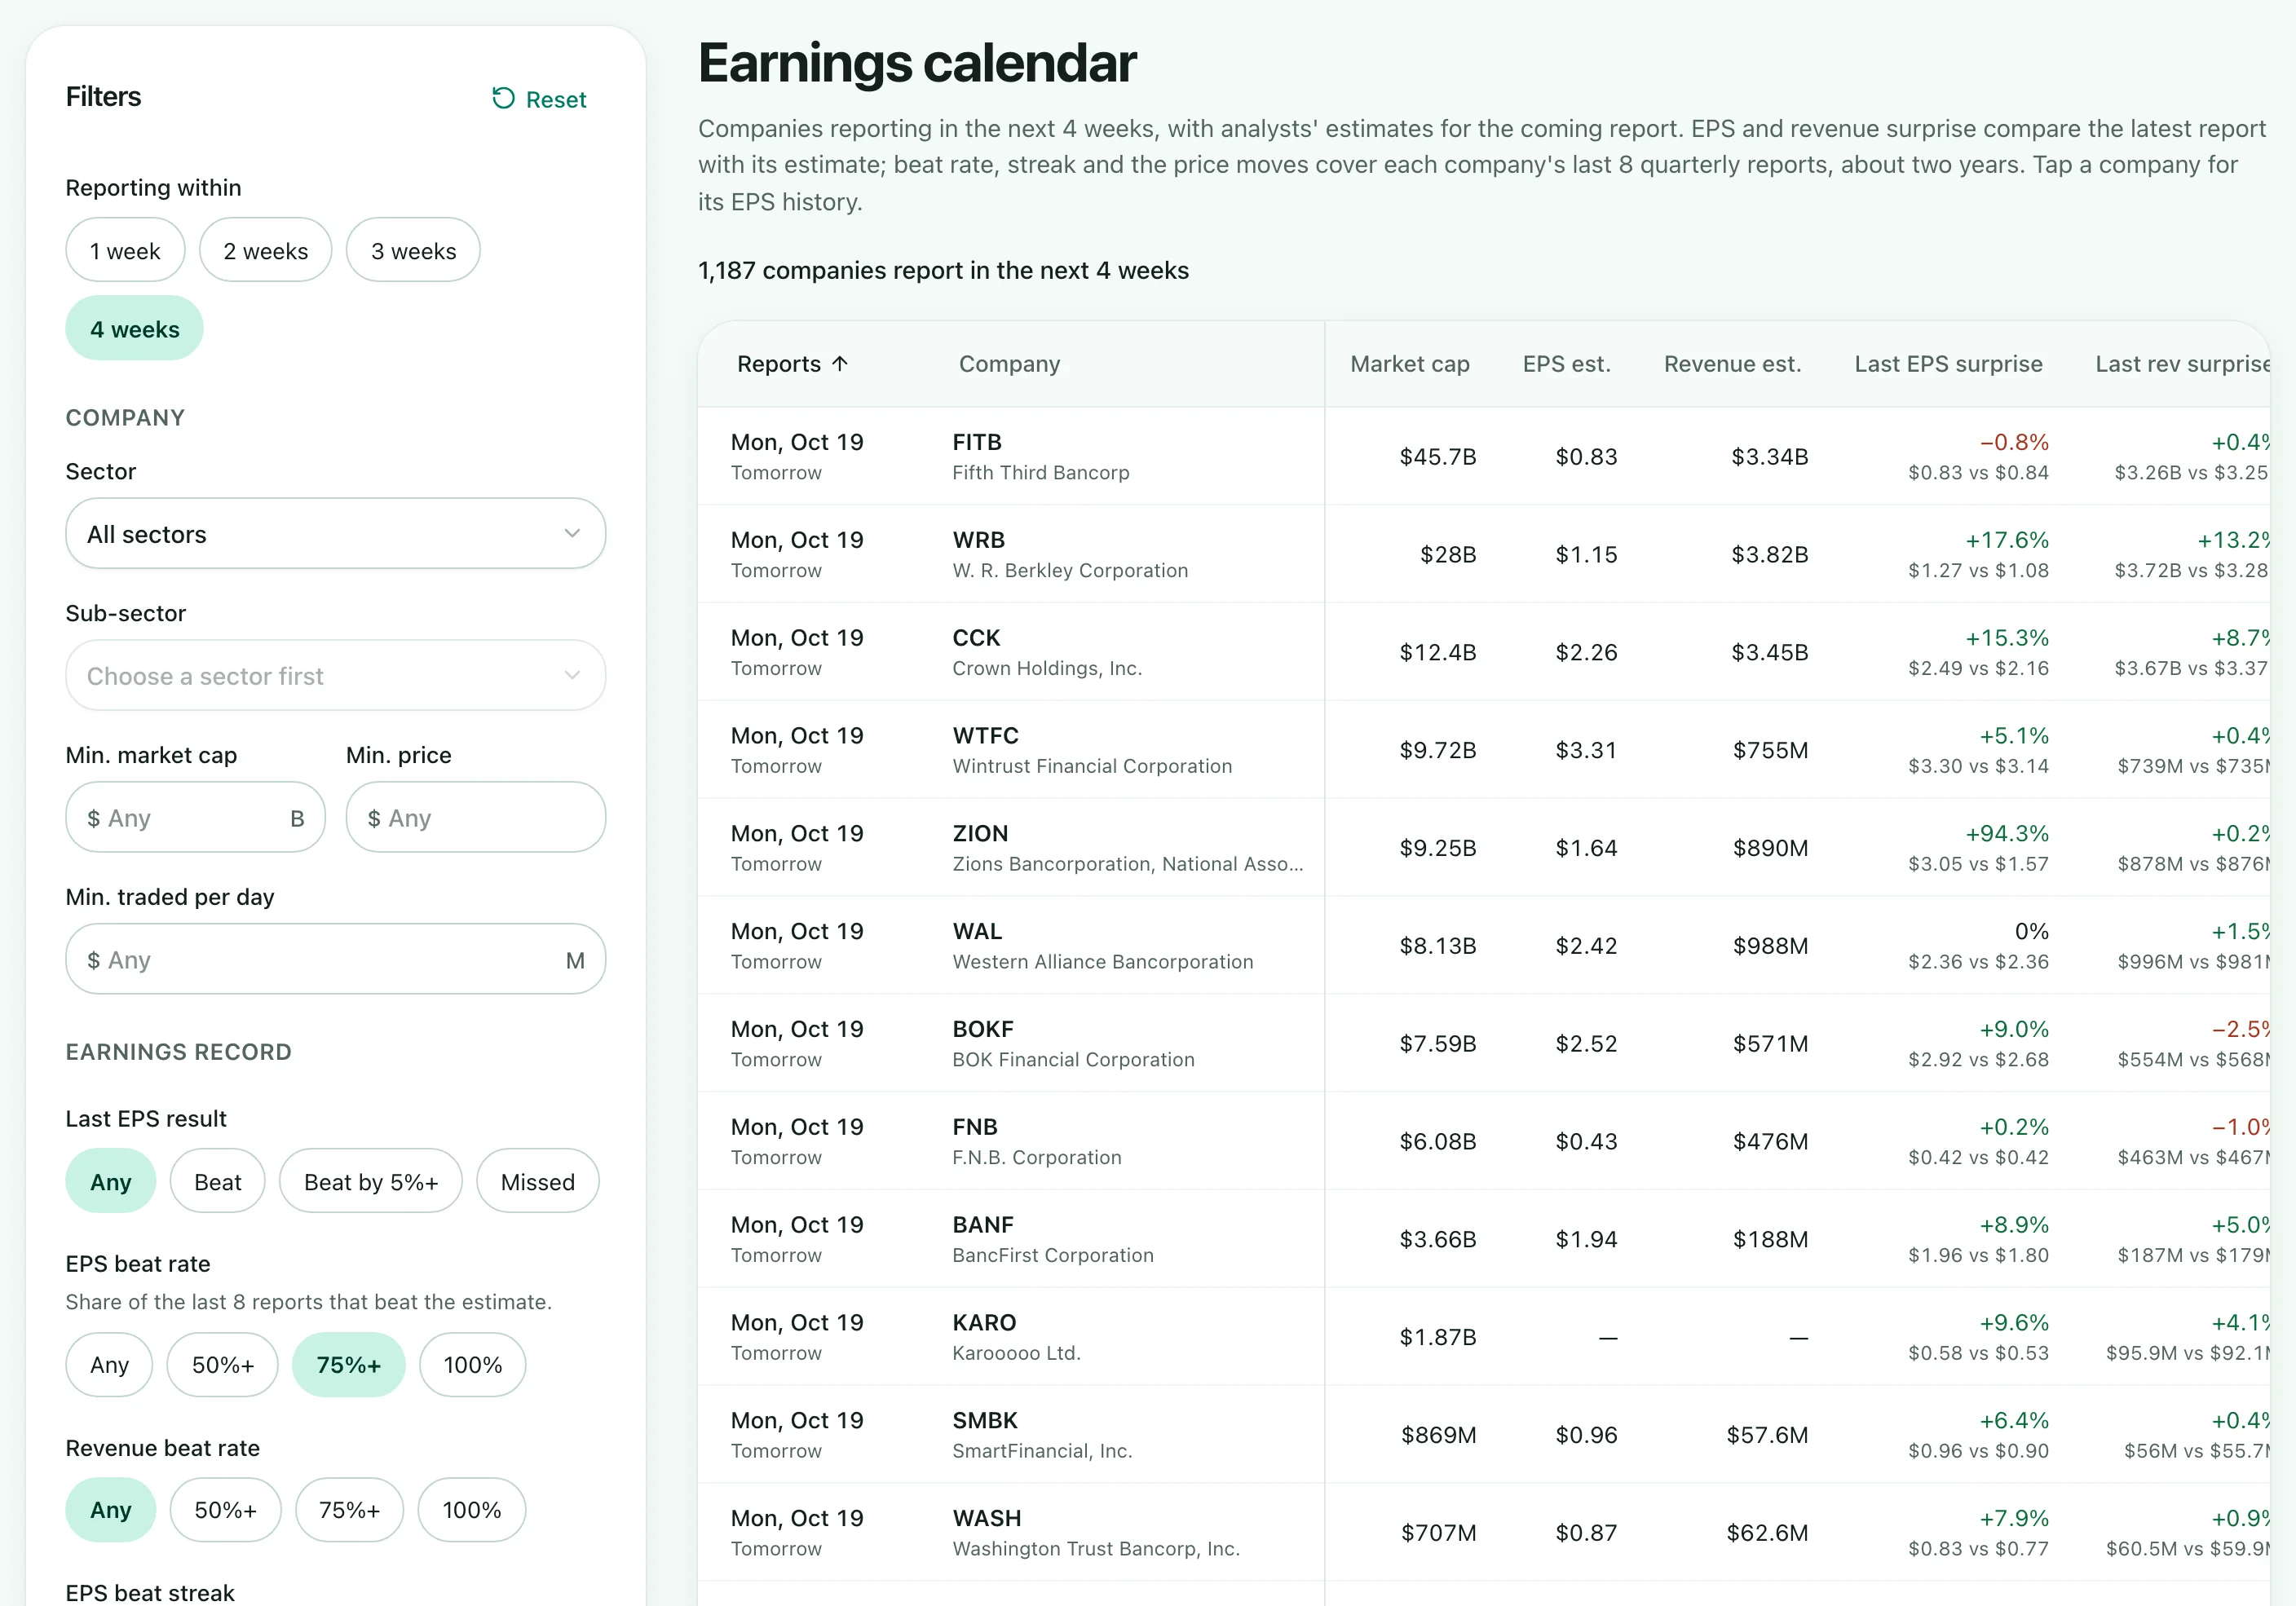
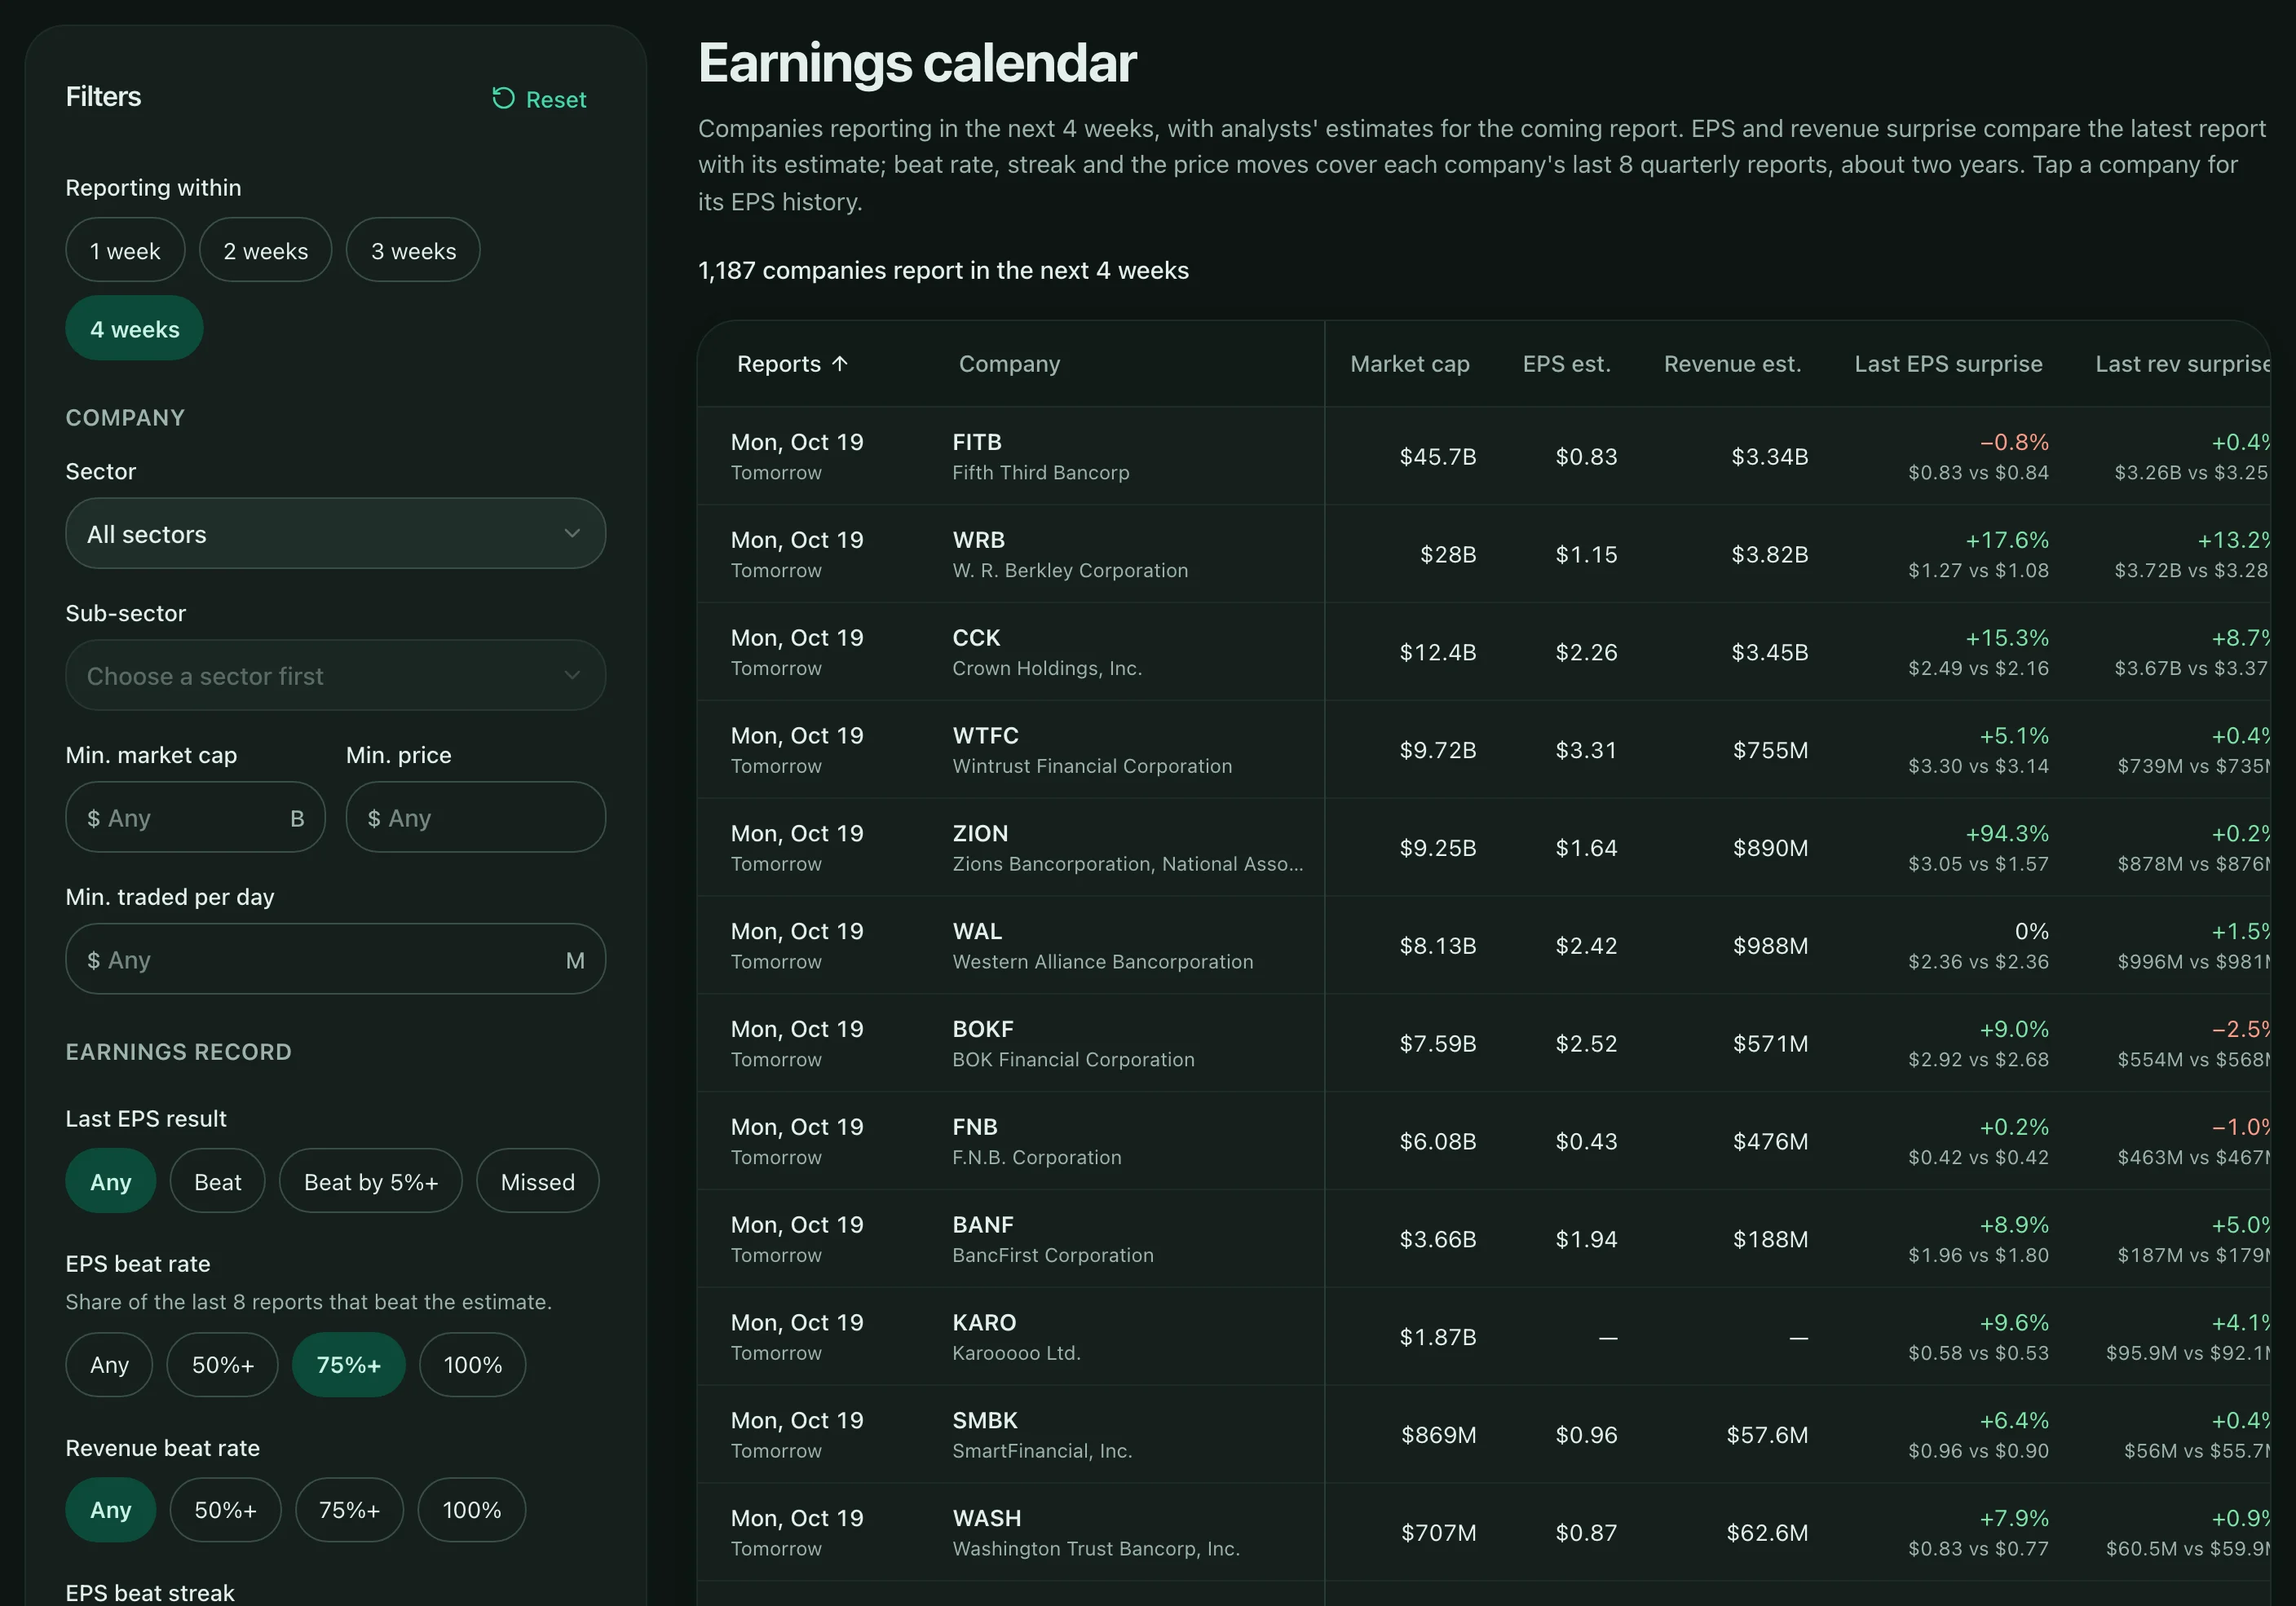
Yes. The earnings calendar covers reports in the next one to four weeks, analyst estimates, past results and report timing before the open or after the close when available; results appear within about 5 minutes of the data provider listing them. The dividend calendar lists ex-dividend and pay dates for stocks and ETFs up to four weeks ahead. The IPO calendar shows upcoming and recently priced US IPOs. The economic calendar, on the Economy page and in the Calendars menu, lists scheduled US releases with forecast and actual figures. Dates can change, and some are missing until announced.
Can I look up a single company?
Yes. Search for any stock or ETF by ticker or name to open its own page: an overview with its price history, key figures, risk checks and every metric, and for stocks the income statement, cash flow and balance sheet for up to 20 years, drawn as where the money comes from and where it goes. A stock's page also shows similar companies side by side, the ETFs that hold it, its next dividend and the latest news.
Can I see how a stock's valuation compares with its own history?
Yes. Each stock's Valuation tab charts its P/E, P/S, P/FCF, EV/EBITDA and P/B over up to 20 years (it opens on 10) and sets today's multiple against the stock's own 5-year and 10-year medians and range. Only companies that report in US dollars are covered, and a median describes the stock's past, not what it is worth.
How fresh is the data?
Scores, metrics, financial statements, and insider and Congress trades are updated each weekday evening, after the US market closes. Super Investor portfolios update as each 13F is filed. During the trading day, members see prices delayed by up to 10 minutes on a stock's or ETF's Today chart, in the home page's index tiles and in My lists, and the earnings calendar takes new results about every 5 minutes (the economic calendar about every 10). Stock Meadow doesn't stream real-time prices.
How do I contact you?
Email hello@stockmeadow.com. A real person (and occasionally a cow) reads every message.
Who's the cow?
That's Moolah, our resident grazer. She chews on the numbers so you don't have to, but she's still a cow, so she can't tell you what to buy.
Is this investment advice?
No. Stock Meadow is a research tool. Scores summarize past financial data and can't predict returns, so always do your own research.

Give it 7 days. Keep your card in your wallet.

You get a 7-day free trial with full access, starting when you set your password.

No card needed. $20 a month after the trial. Cancel any time. Already have an account? Sign in