
Cows love green and so do we 💚
Free during the invite-only preview
Find stocks worth a closer look, with scores you understand.
Stock Meadow ranks about 2,000 US stocks by the measures you care about. Choose a proven scoring model or build your own, and see exactly why each stock scores the way it does.
No card needed. Sign in with a one-time code sent to your email.
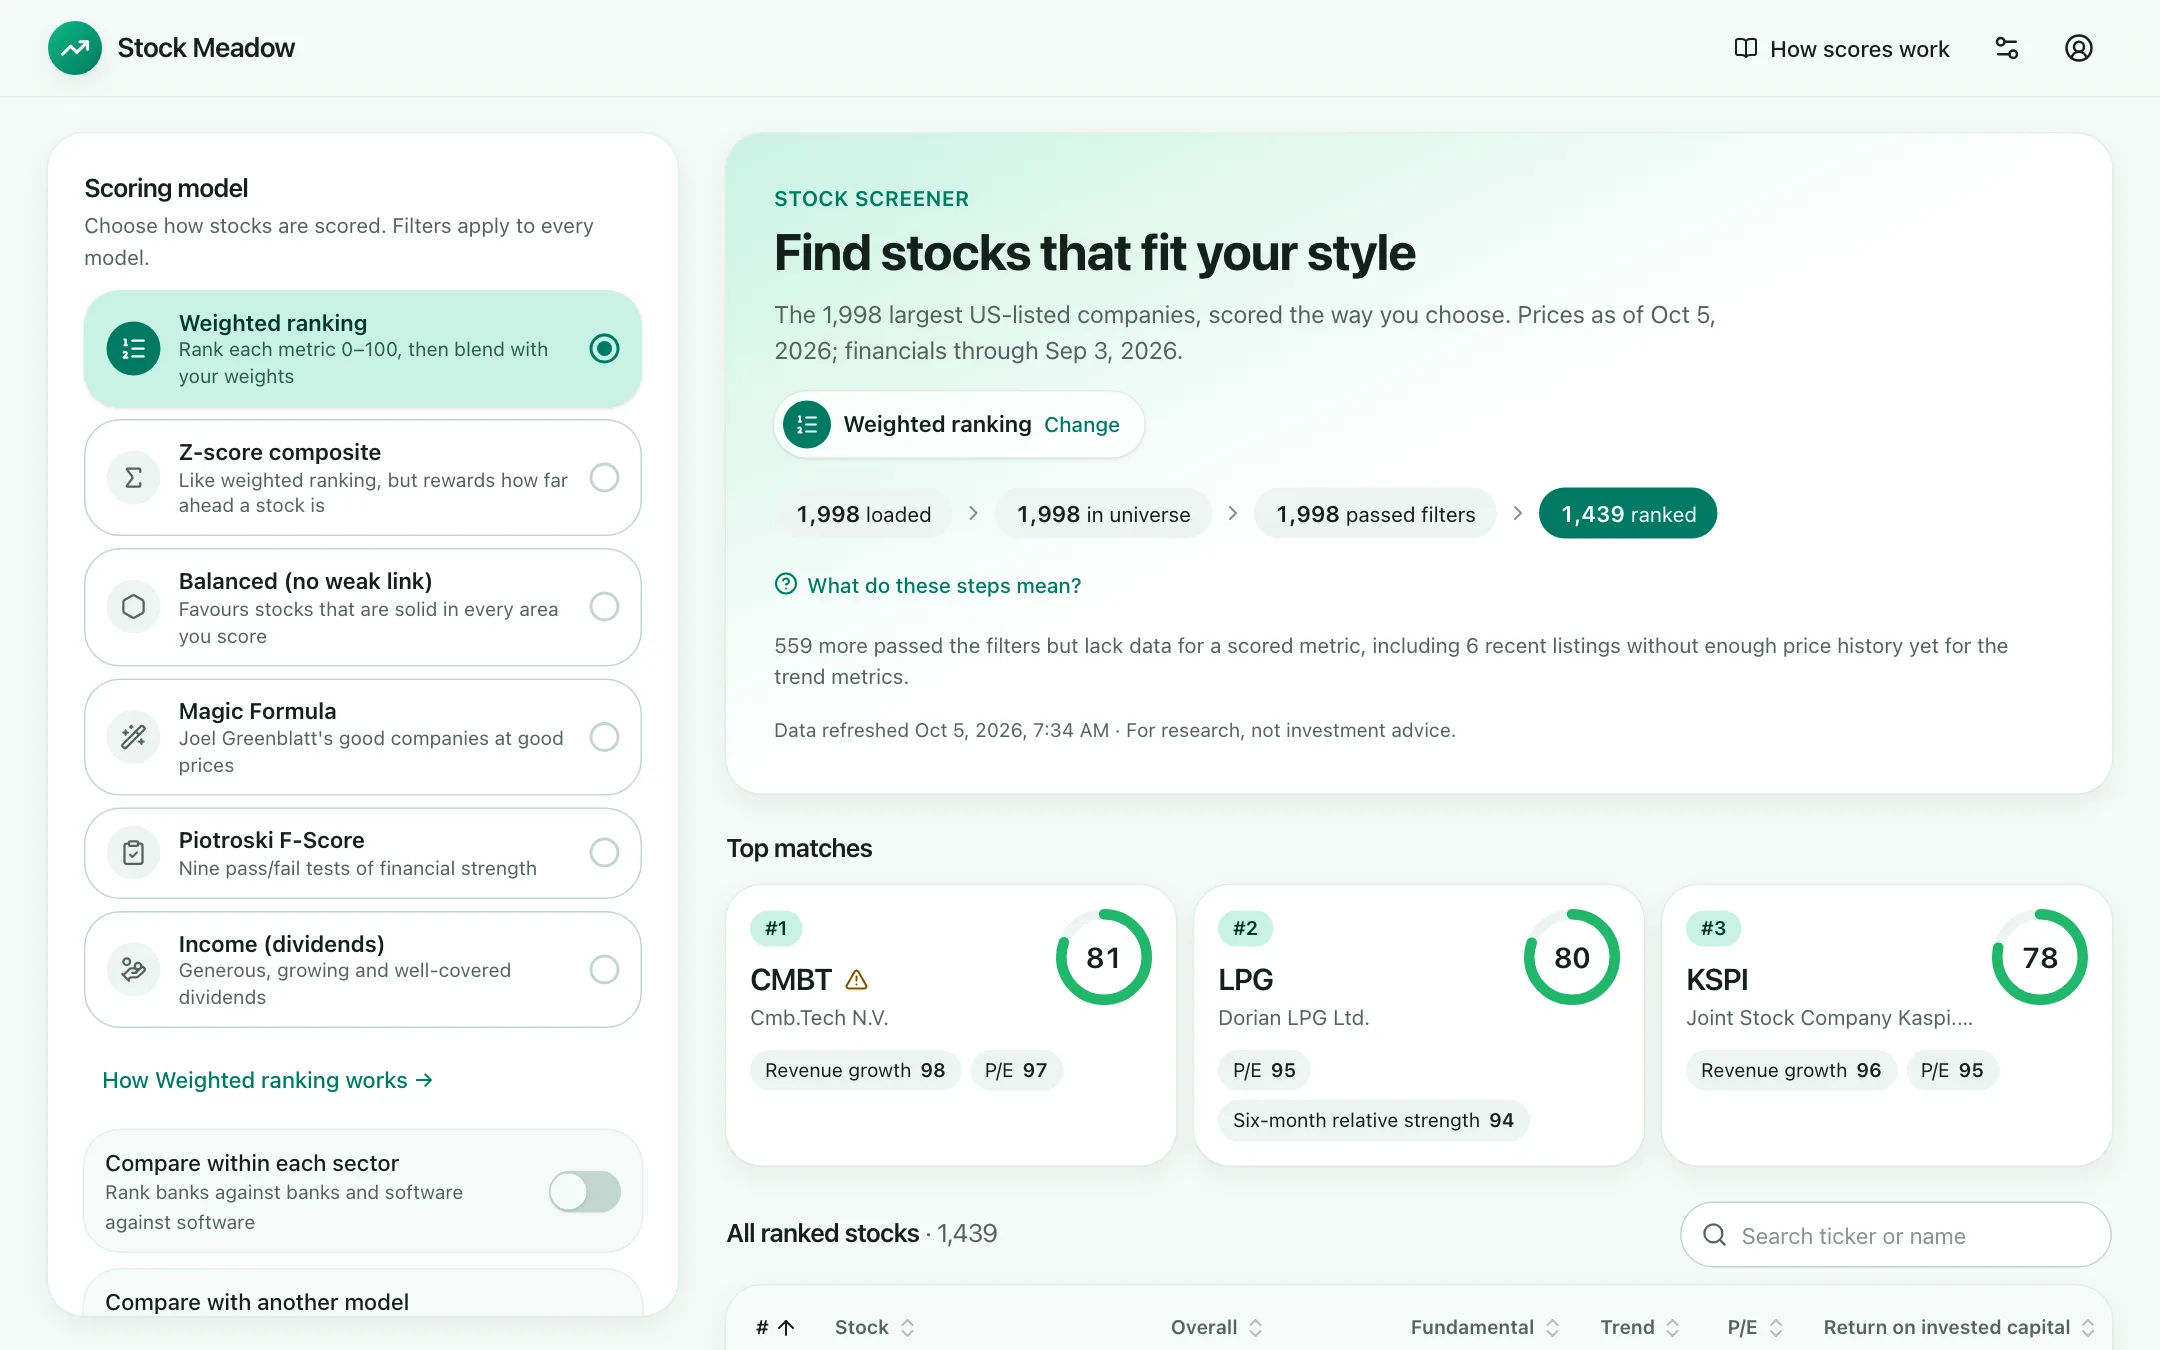
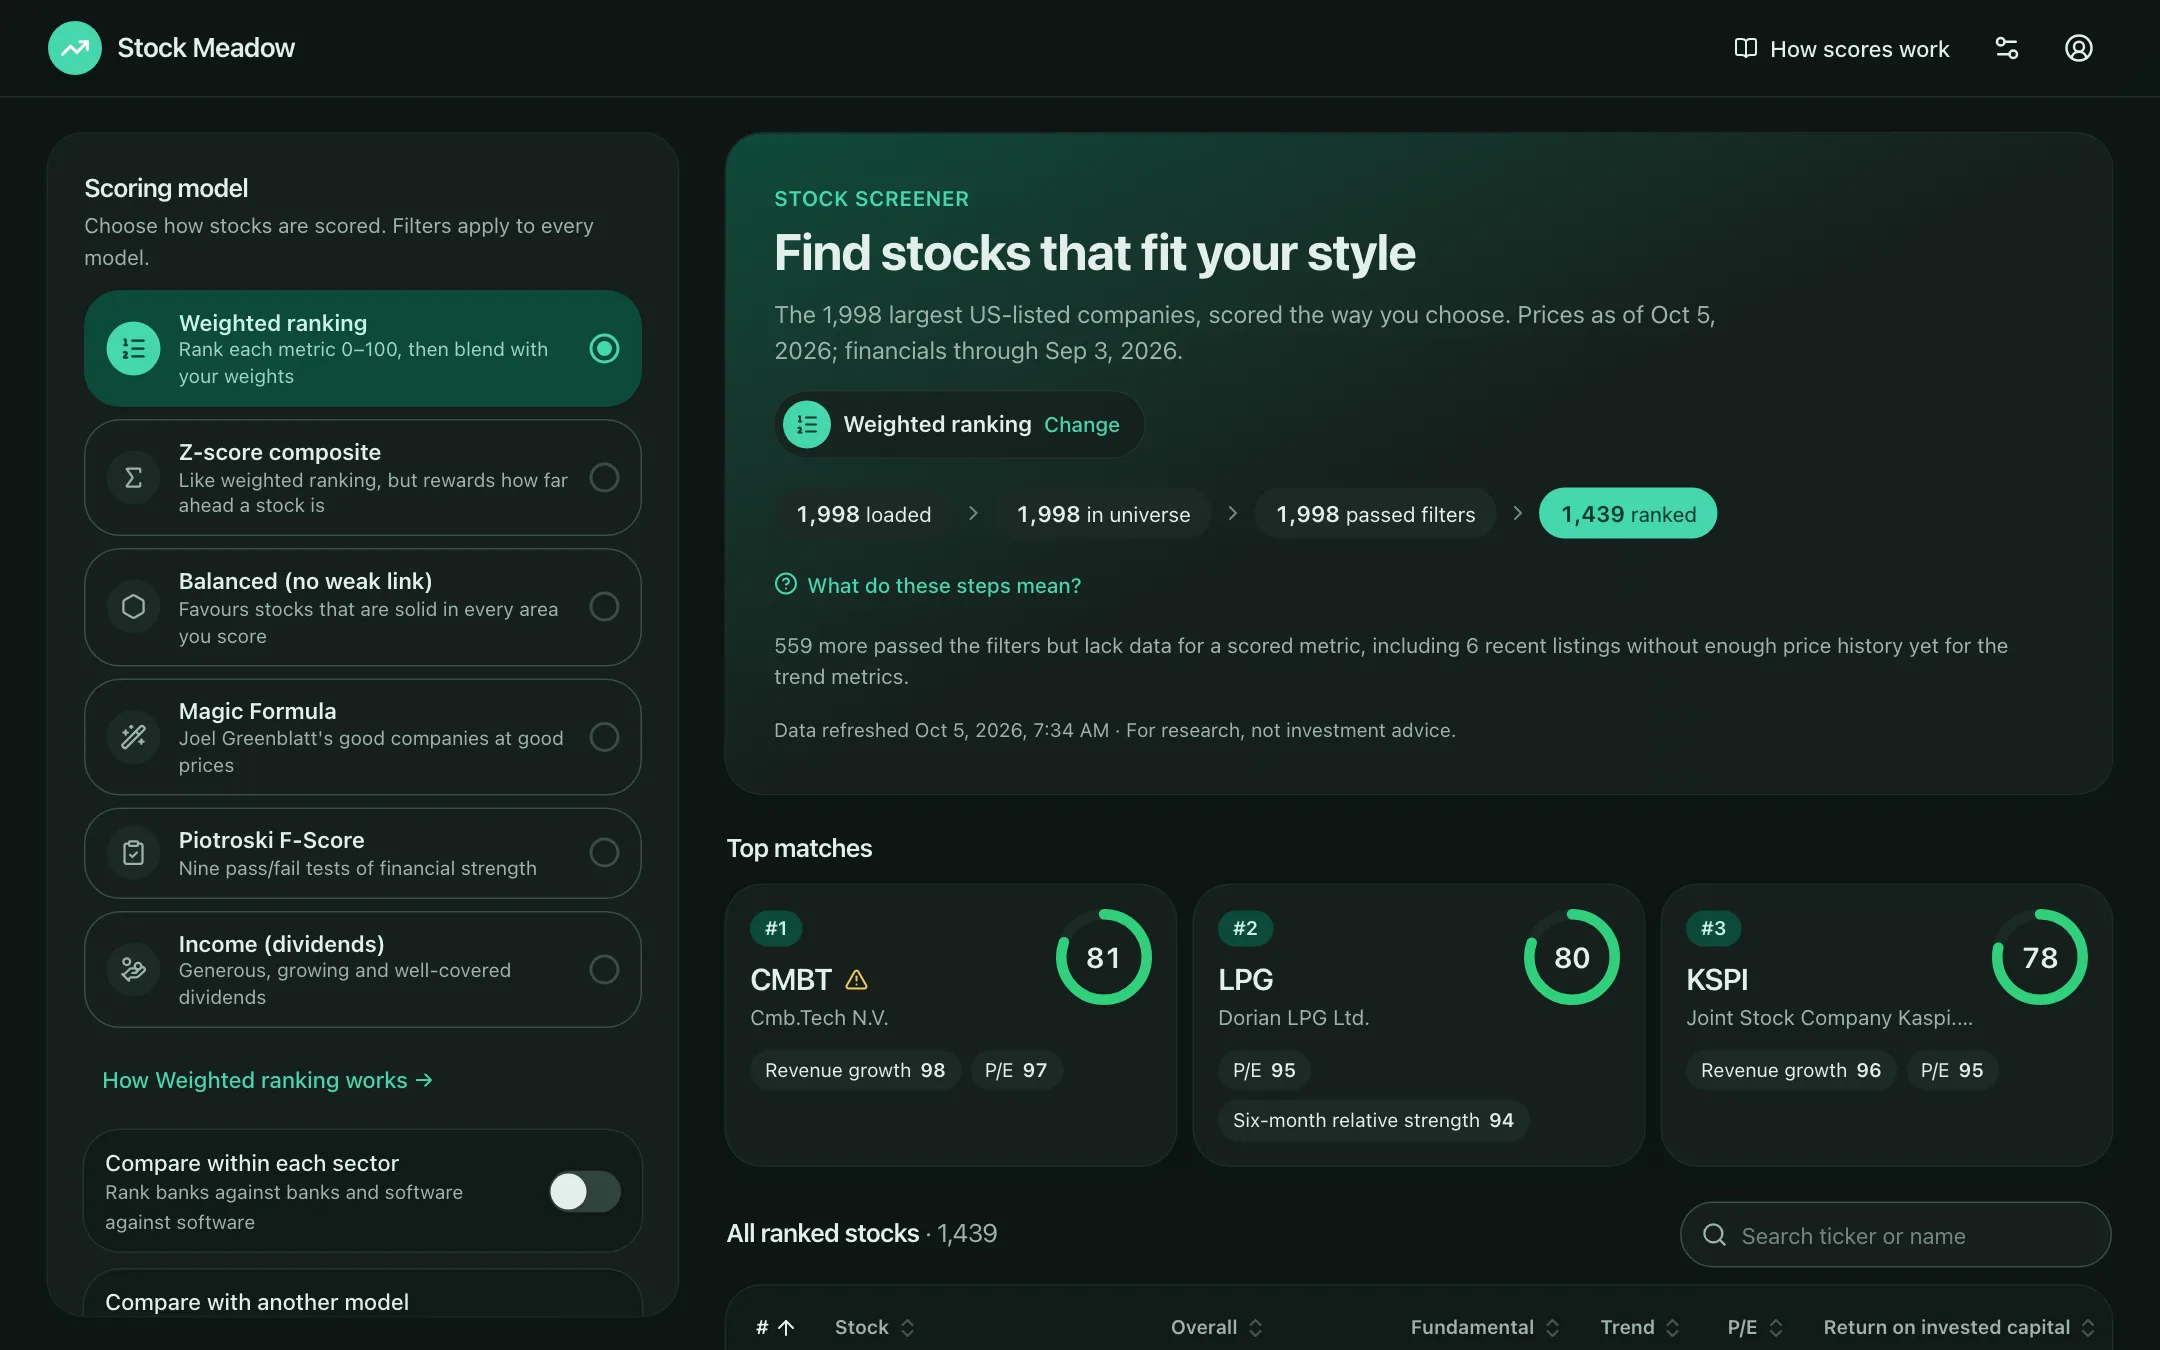
- ~2,000US stocks, the largest by market value
- 32metrics, from P/E to 12-month momentum
- 6scoring models, from your own recipe to the Magic Formula
- Dailyupdates every weekday evening, after the market closes
How it works
From 2,000 stocks to a shortlist in a minute
- 1
Start with a style
Balanced, Value, Quality, Growth, Momentum, or your own Custom mix.
- 2
Tune metrics and filters
Weight what you care about. Filter out what you don't.
- 3
Read a ranked list
Every stock gets a 0–100 score you can open up and understand.
What you get
A look inside the app
These are real screens from Stock Meadow, so you know exactly what you're signing up for.
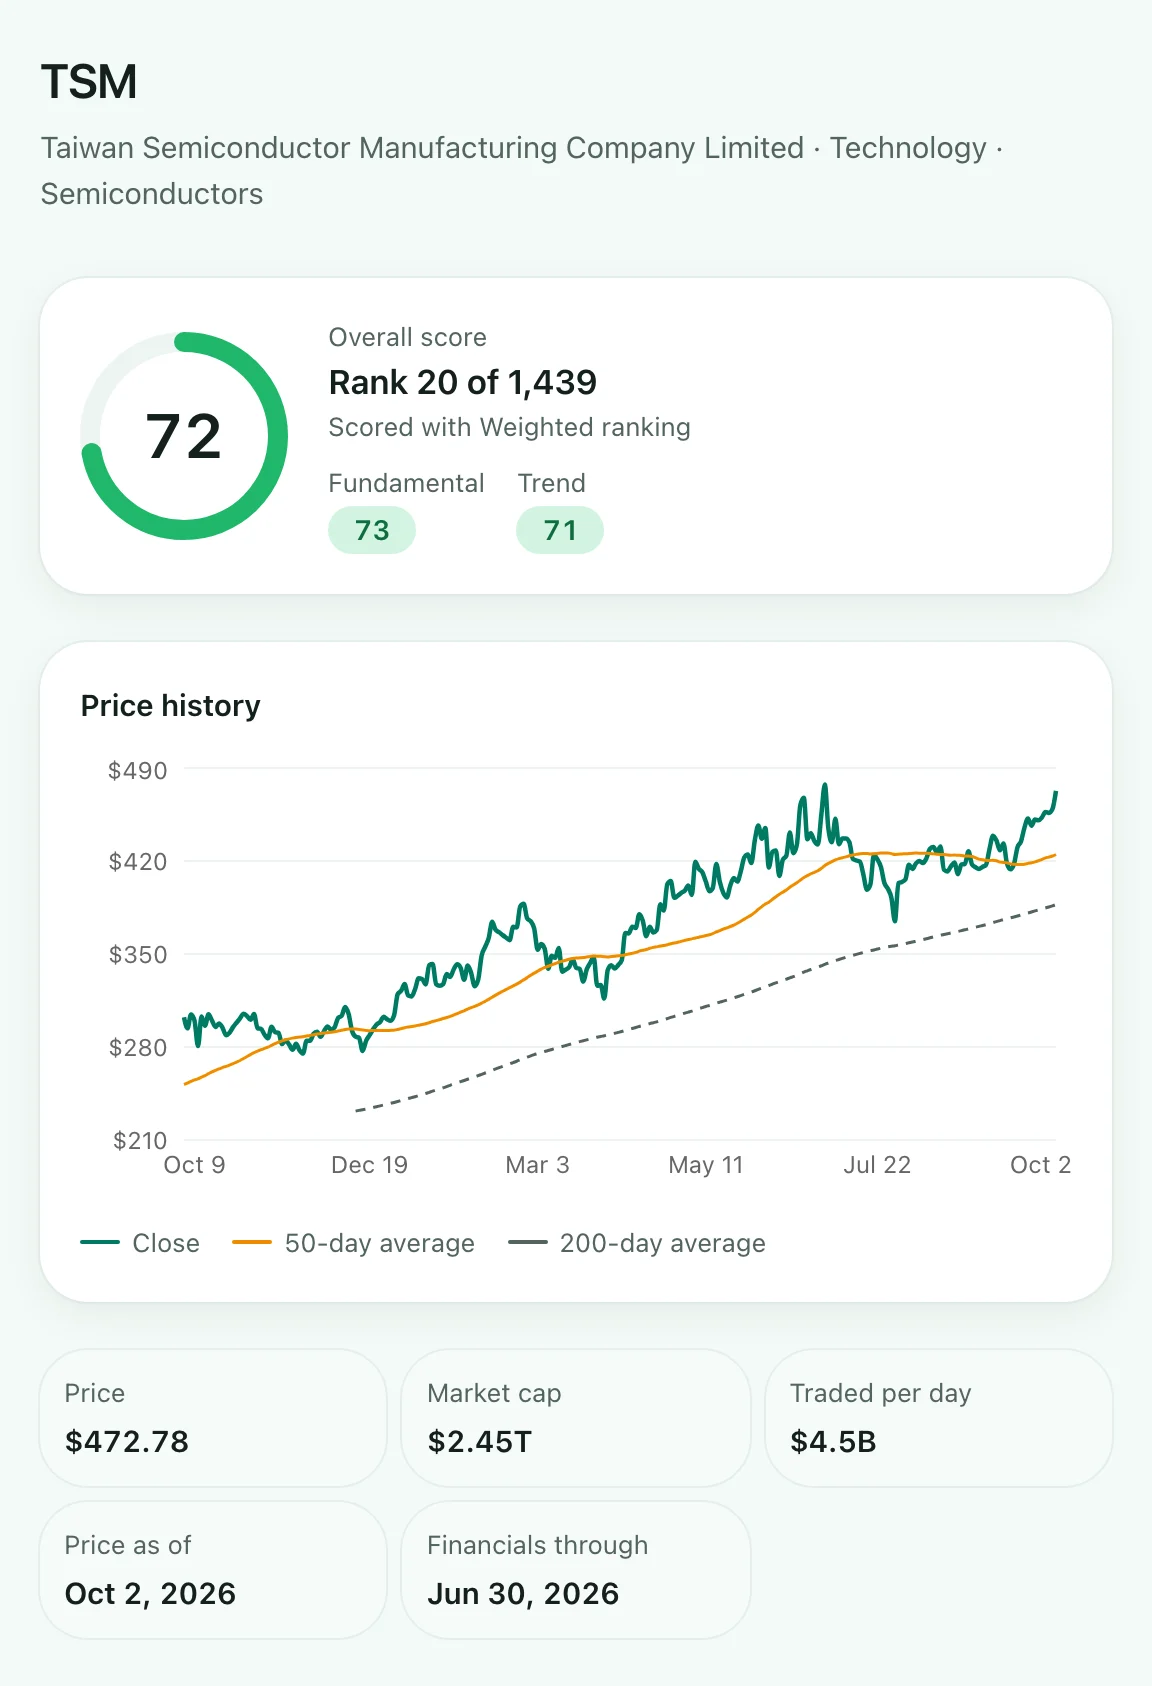
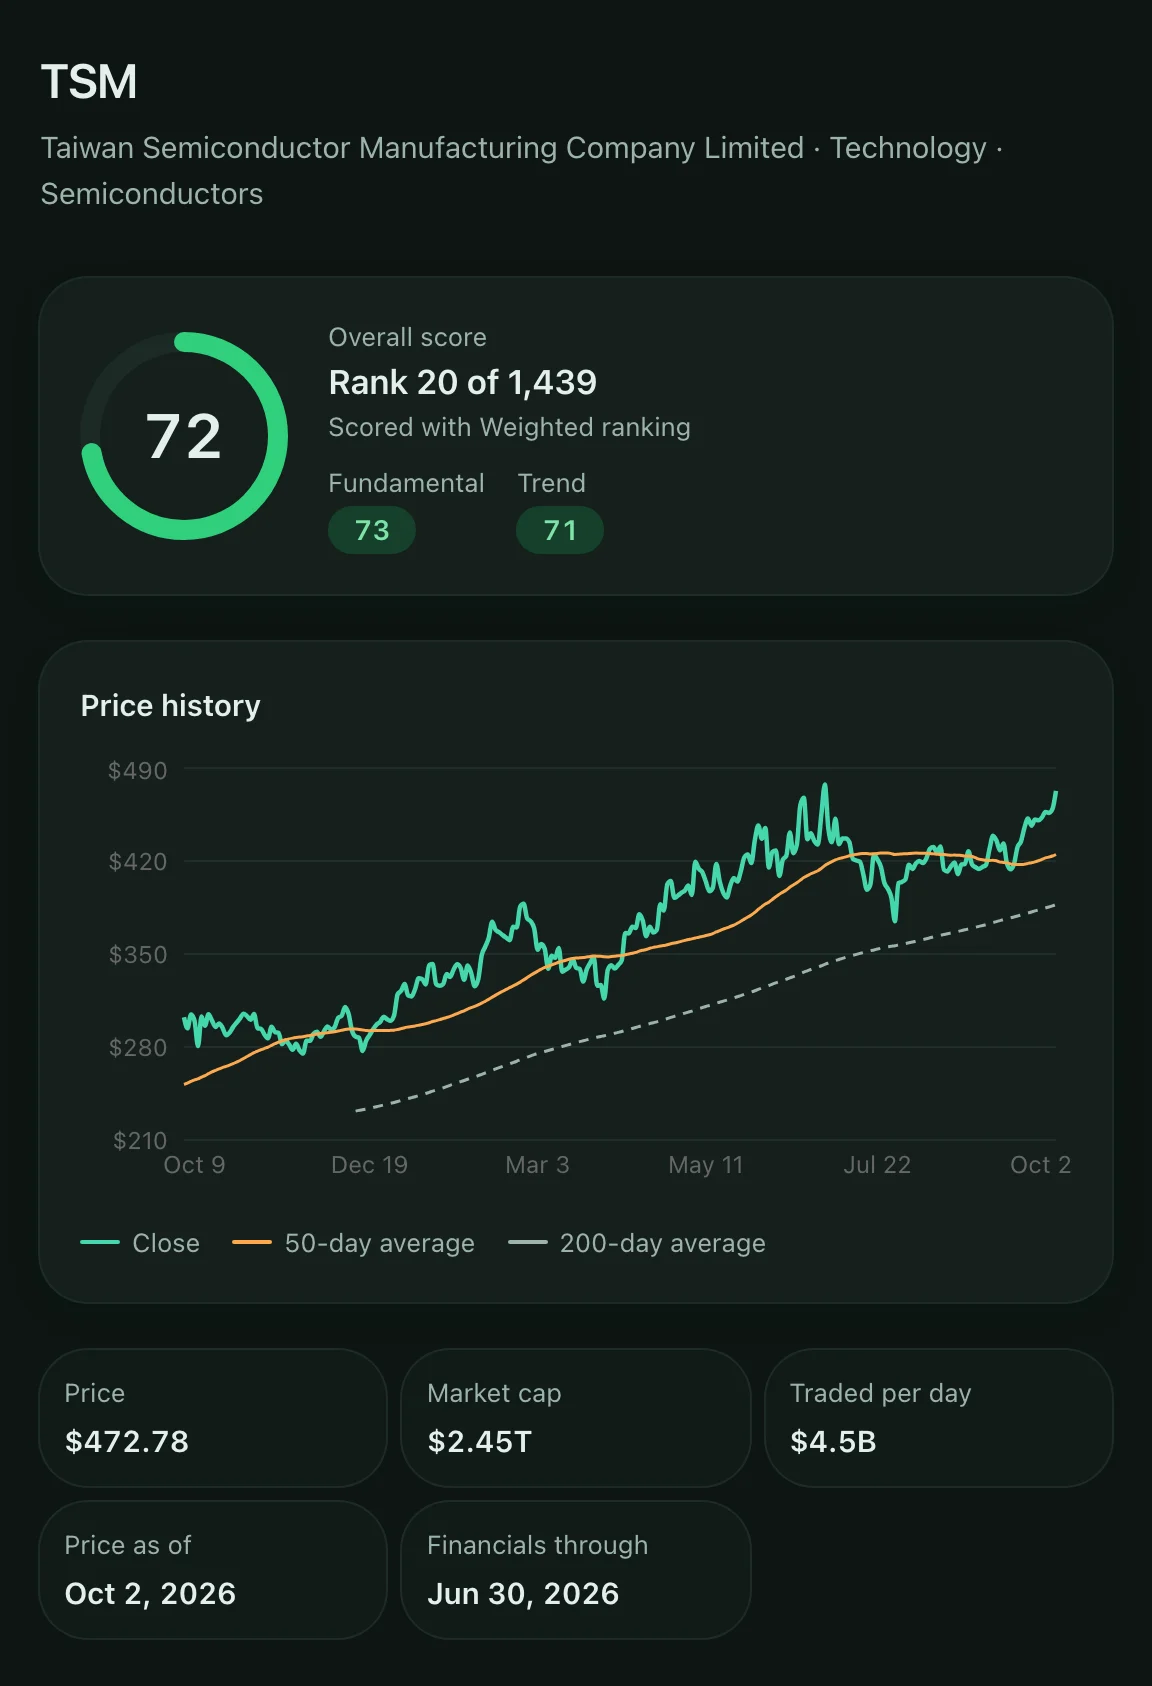
Open any stock and see the whole picture
Tap a stock to open its page: its overall score and rank, separate fundamental and trend scores, and about a year of prices charted against the 50- and 200-day averages.
- Price, market cap and dollars traded per day
- The dates of the latest price and financials, so you know how fresh they are
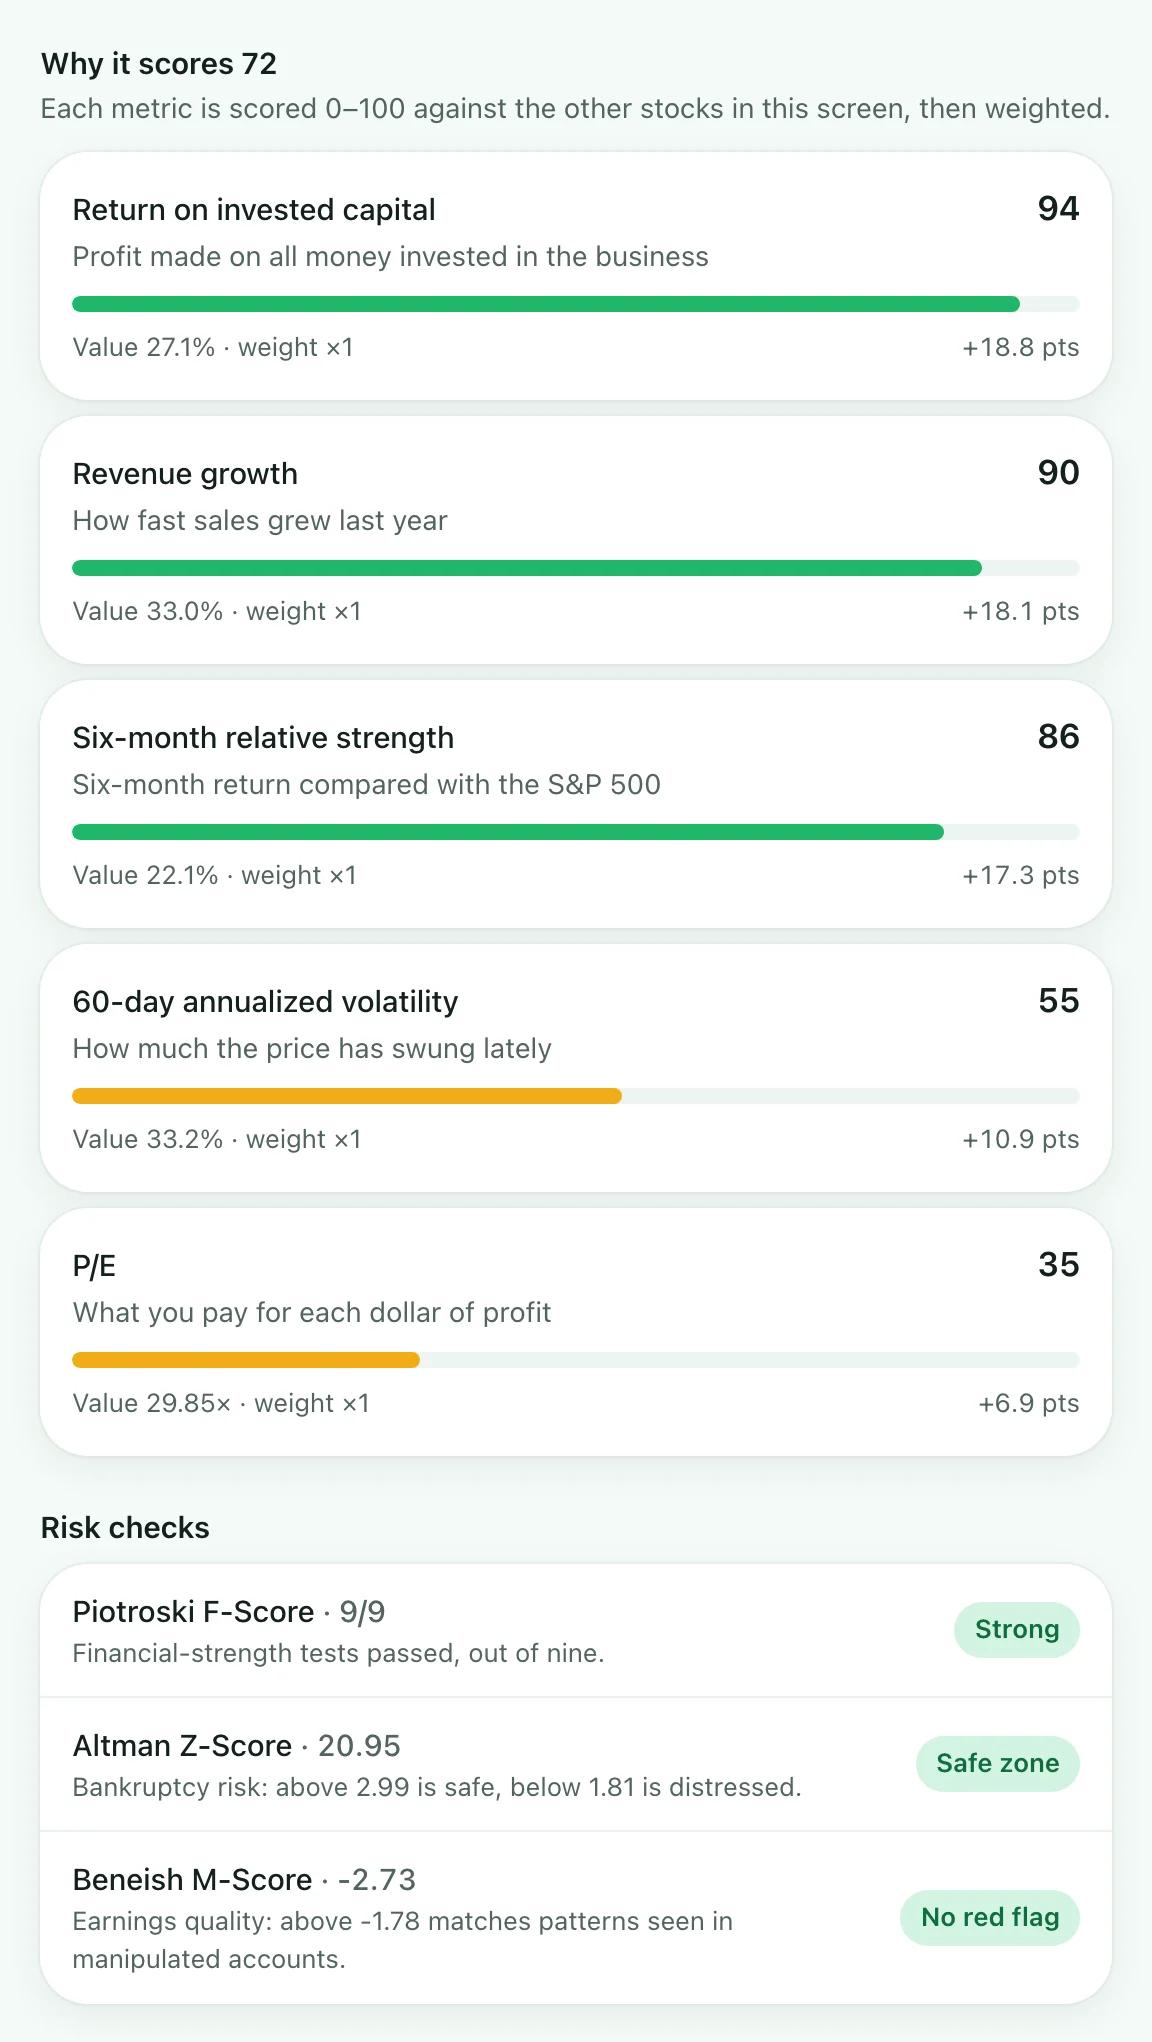
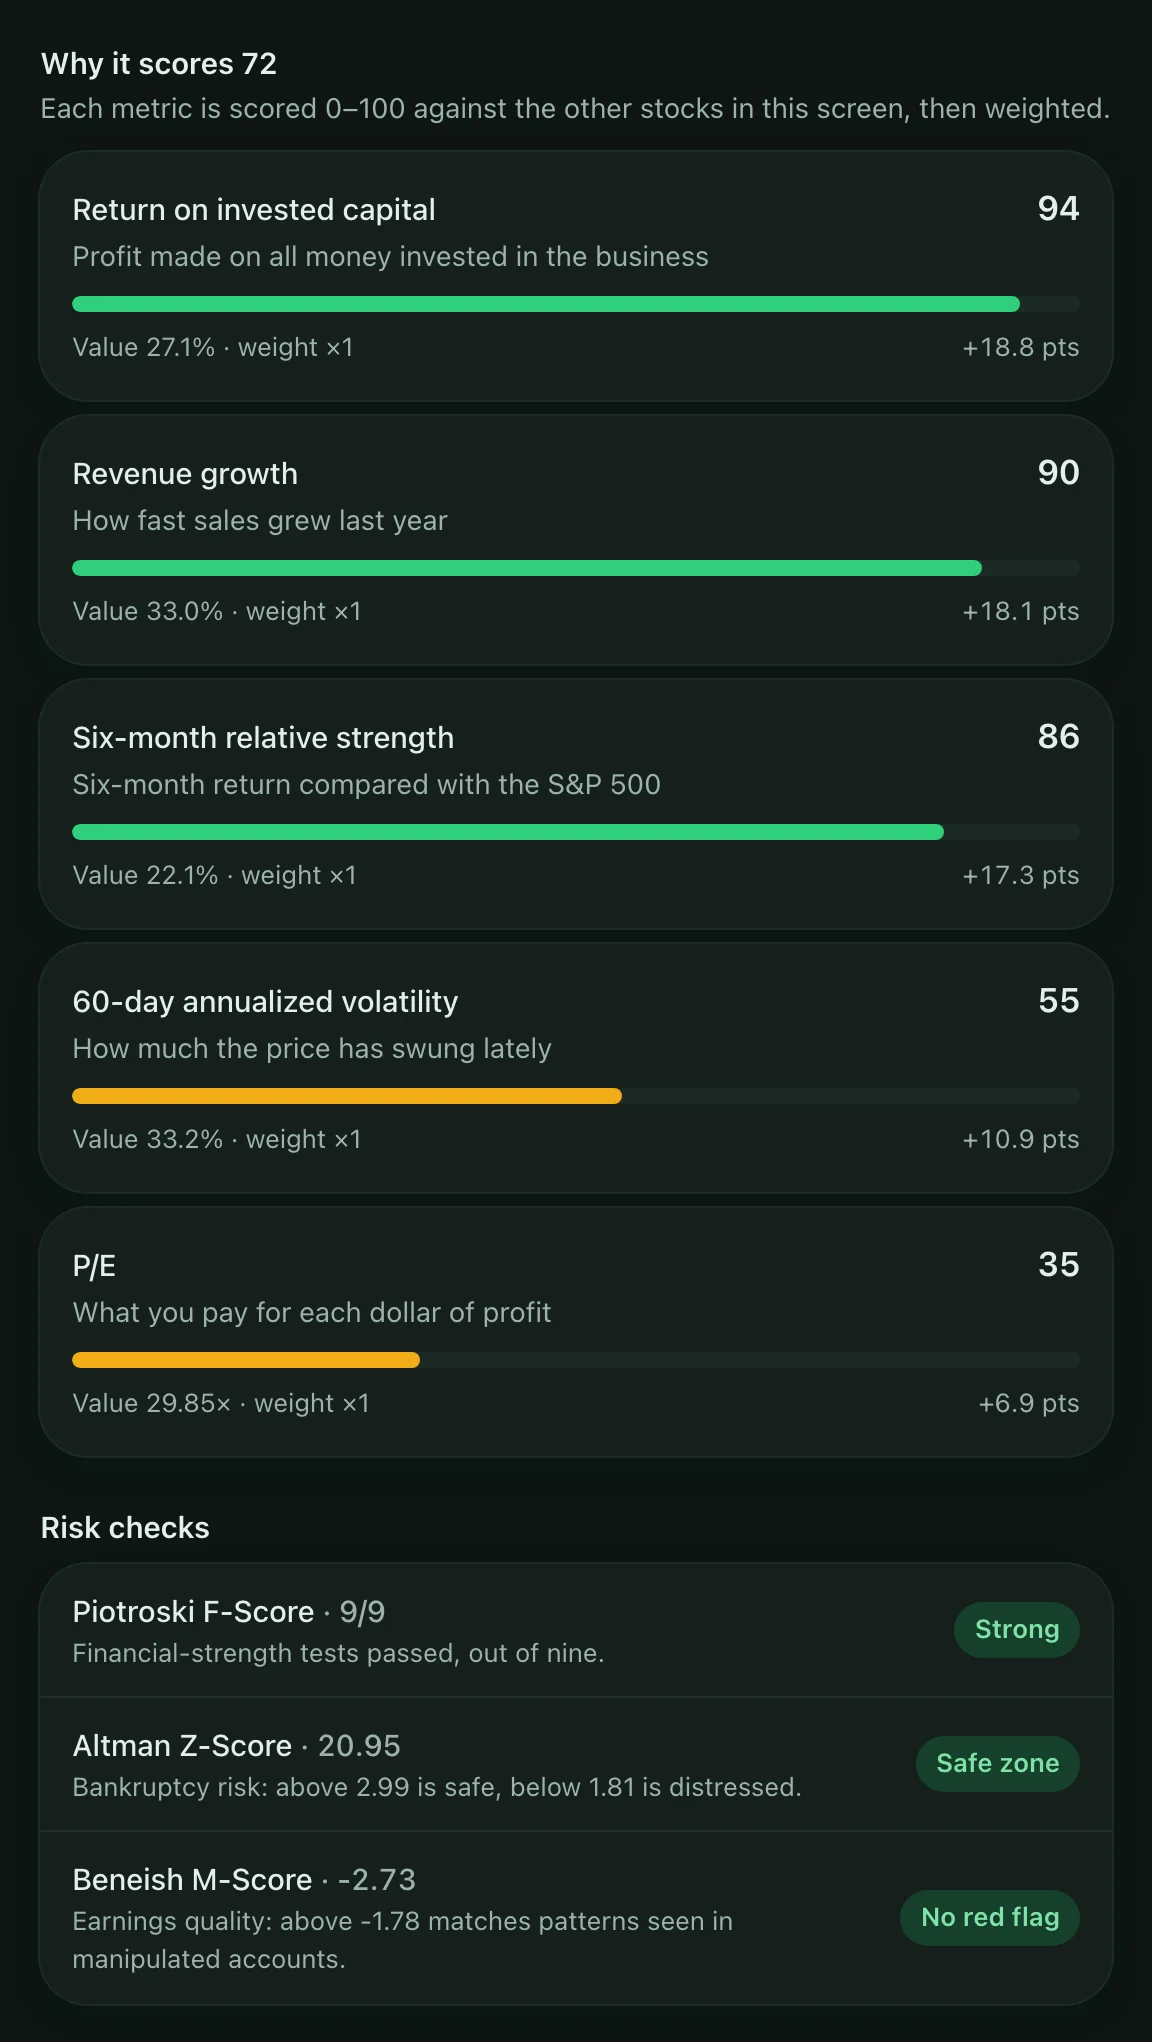
Know exactly why it scored that way
No black box. Each metric shows its own 0–100 score, the company's actual figure, the weight you gave it, and how many points it added.
- Three risk checks on every stock: the Piotroski F-Score for financial strength, the Altman Z-Score for bankruptcy risk and the Beneish M-Score for earnings quality
- A warning triangle marks stocks in the distress zone or with an earnings red flag, so you see it before you dig in
Build the score you want
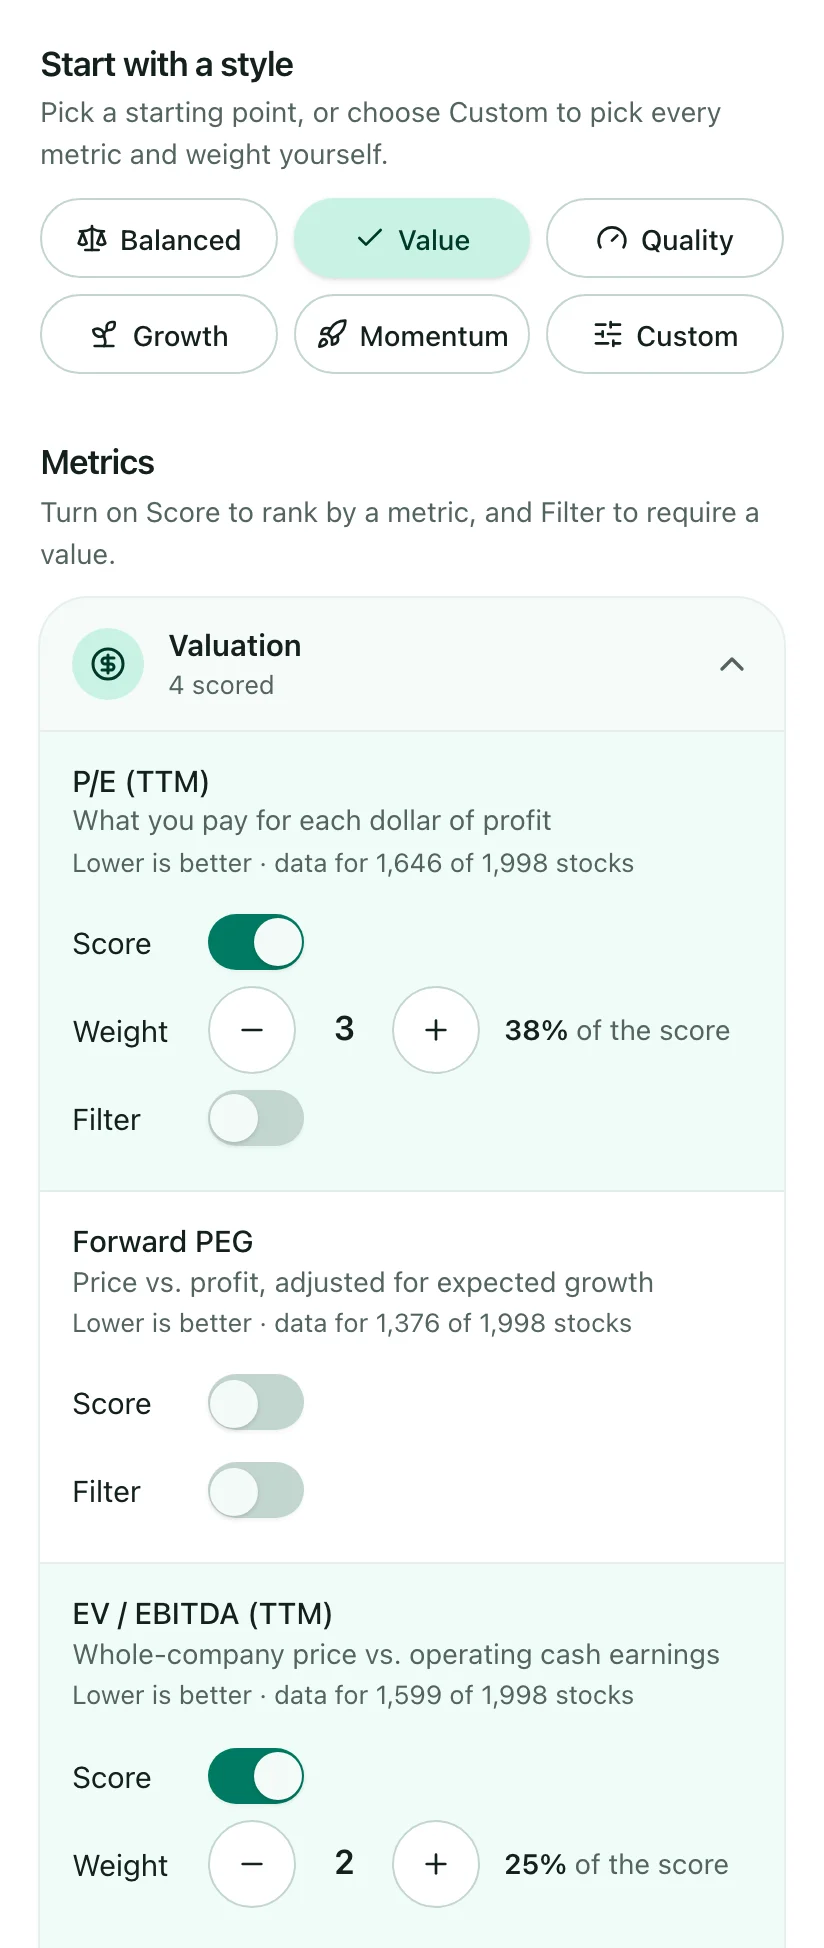
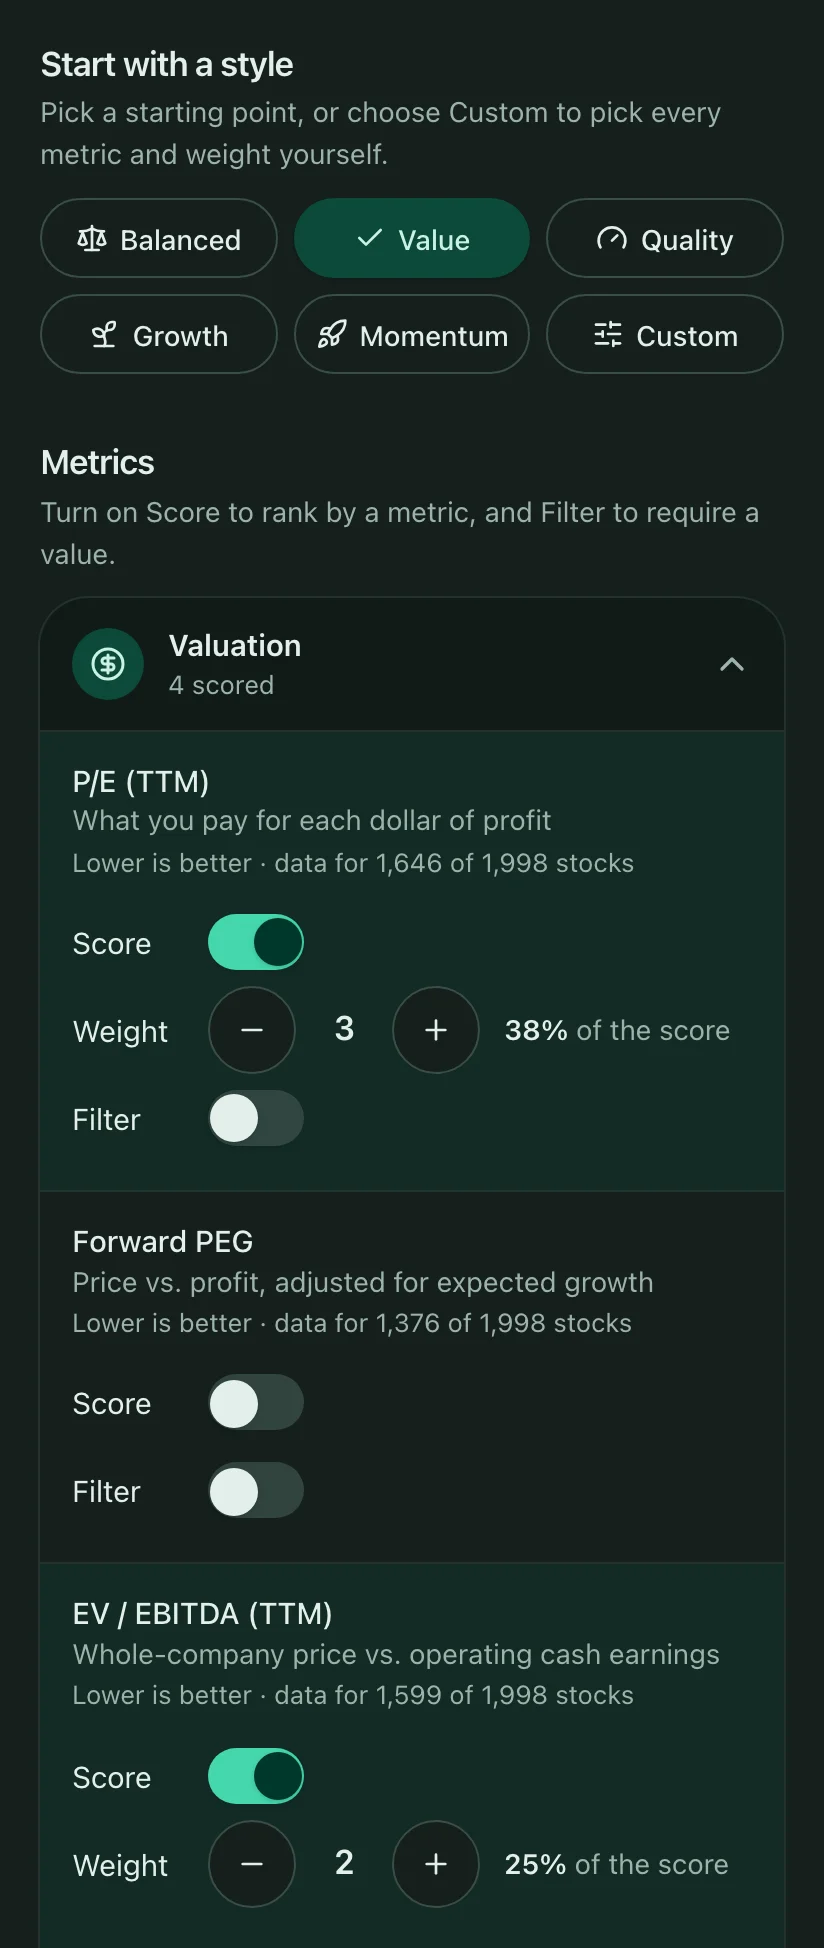
Start with a style, then make it yours. Turn on any of the 29 scoring metrics and press − or + to weight it from 1 to 10.
- Each metric shows its share of the score, and how many stocks have data for it
- Filter on any metric: below, above or between values, such as P/E below 20
- Narrow the list by sector, market cap, share price and trading volume
Compare two models side by side
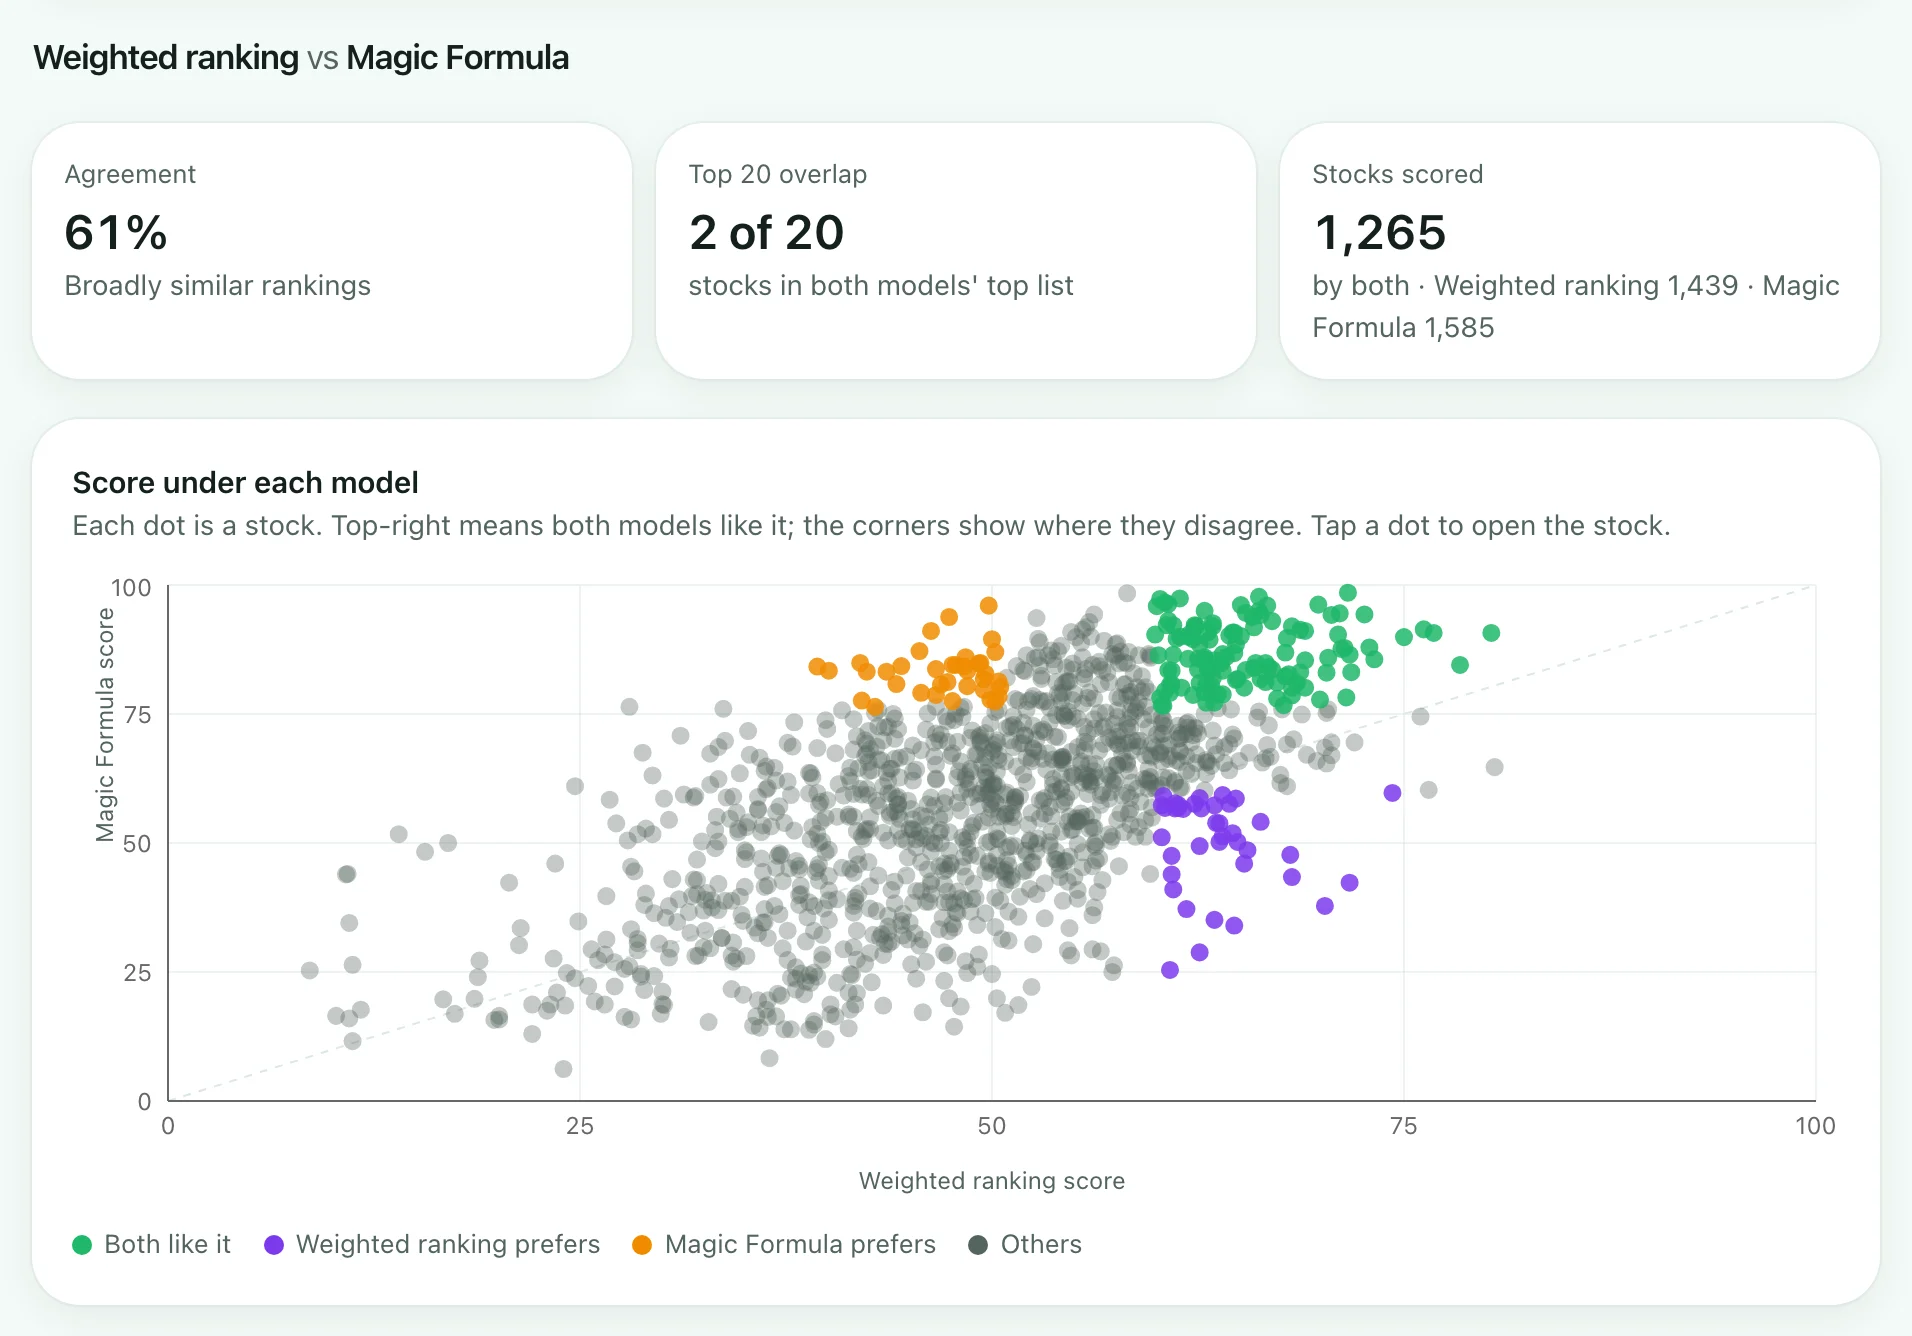
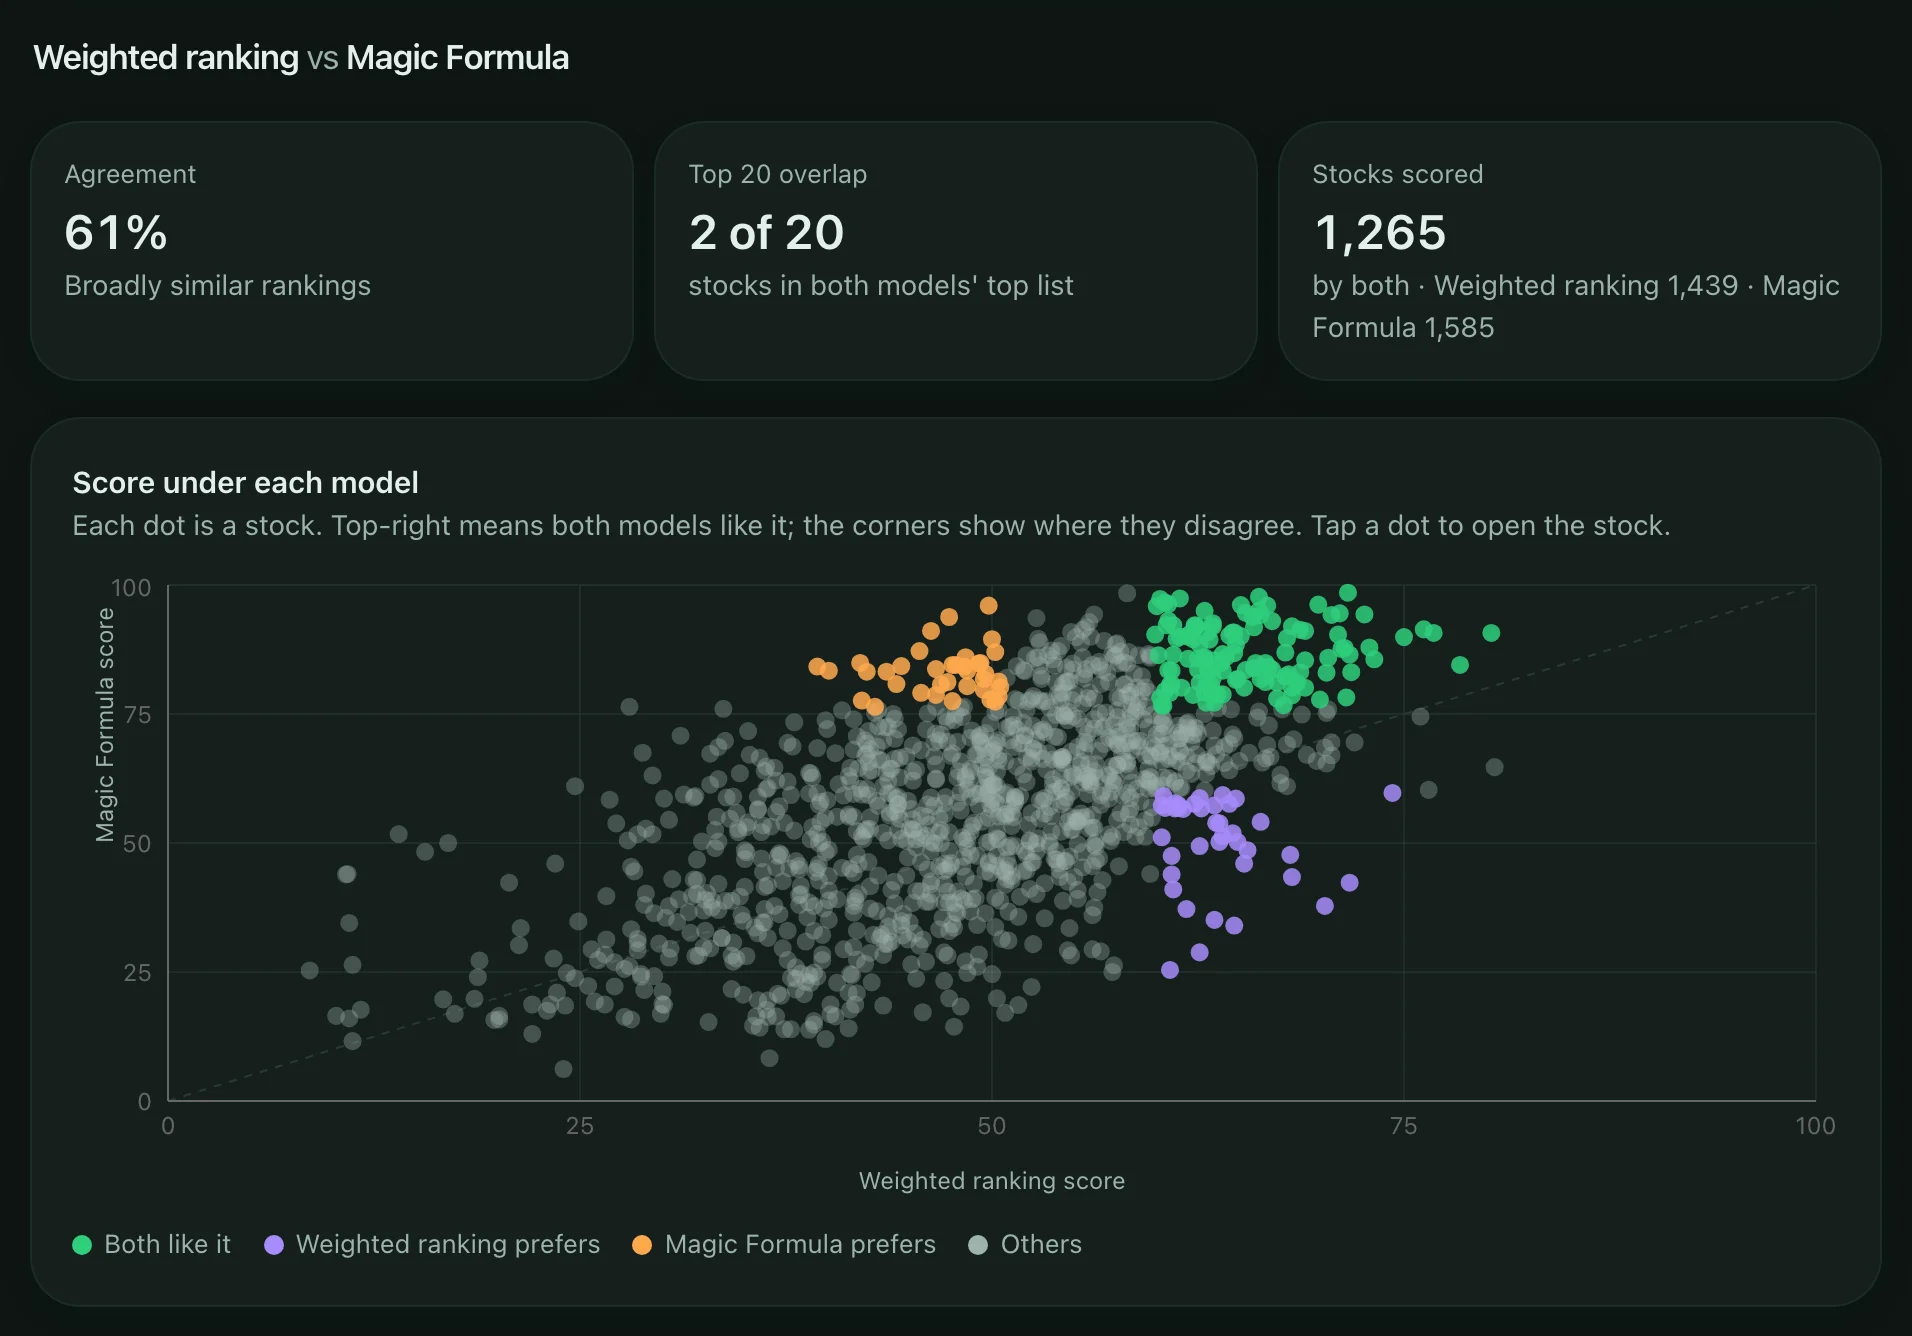
Pick a second model and see where they agree: an agreement score, how many stocks make both top-20 lists, a chart of every stock under both, and a list of the biggest disagreements.
Or skip the scores and just screen
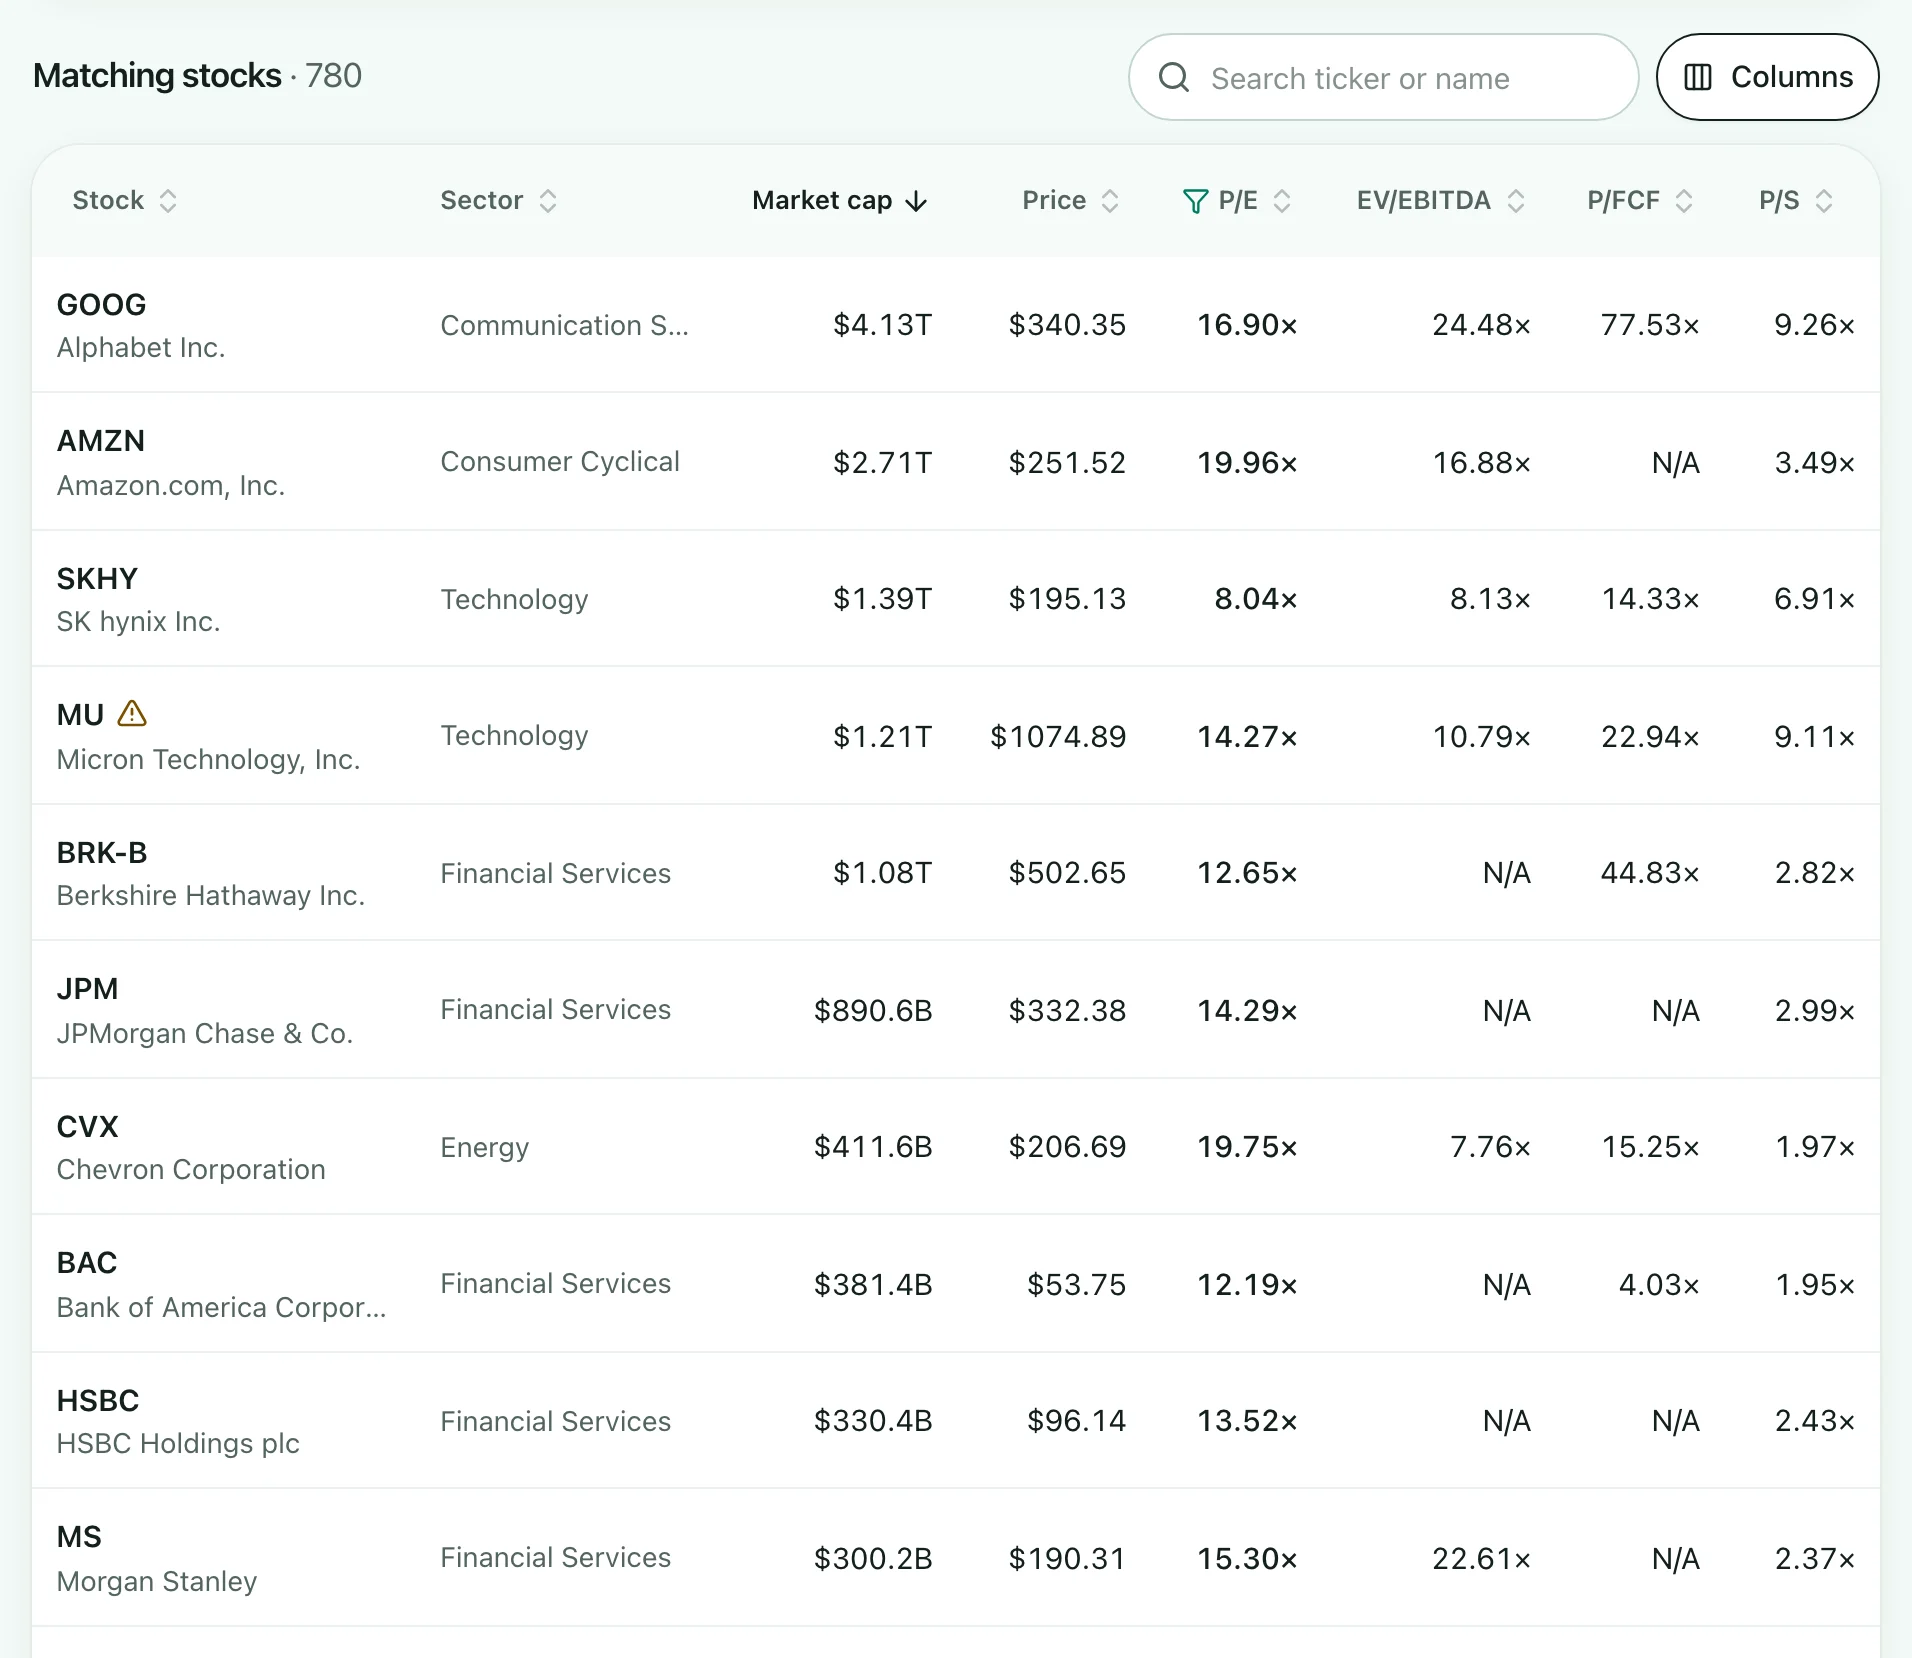
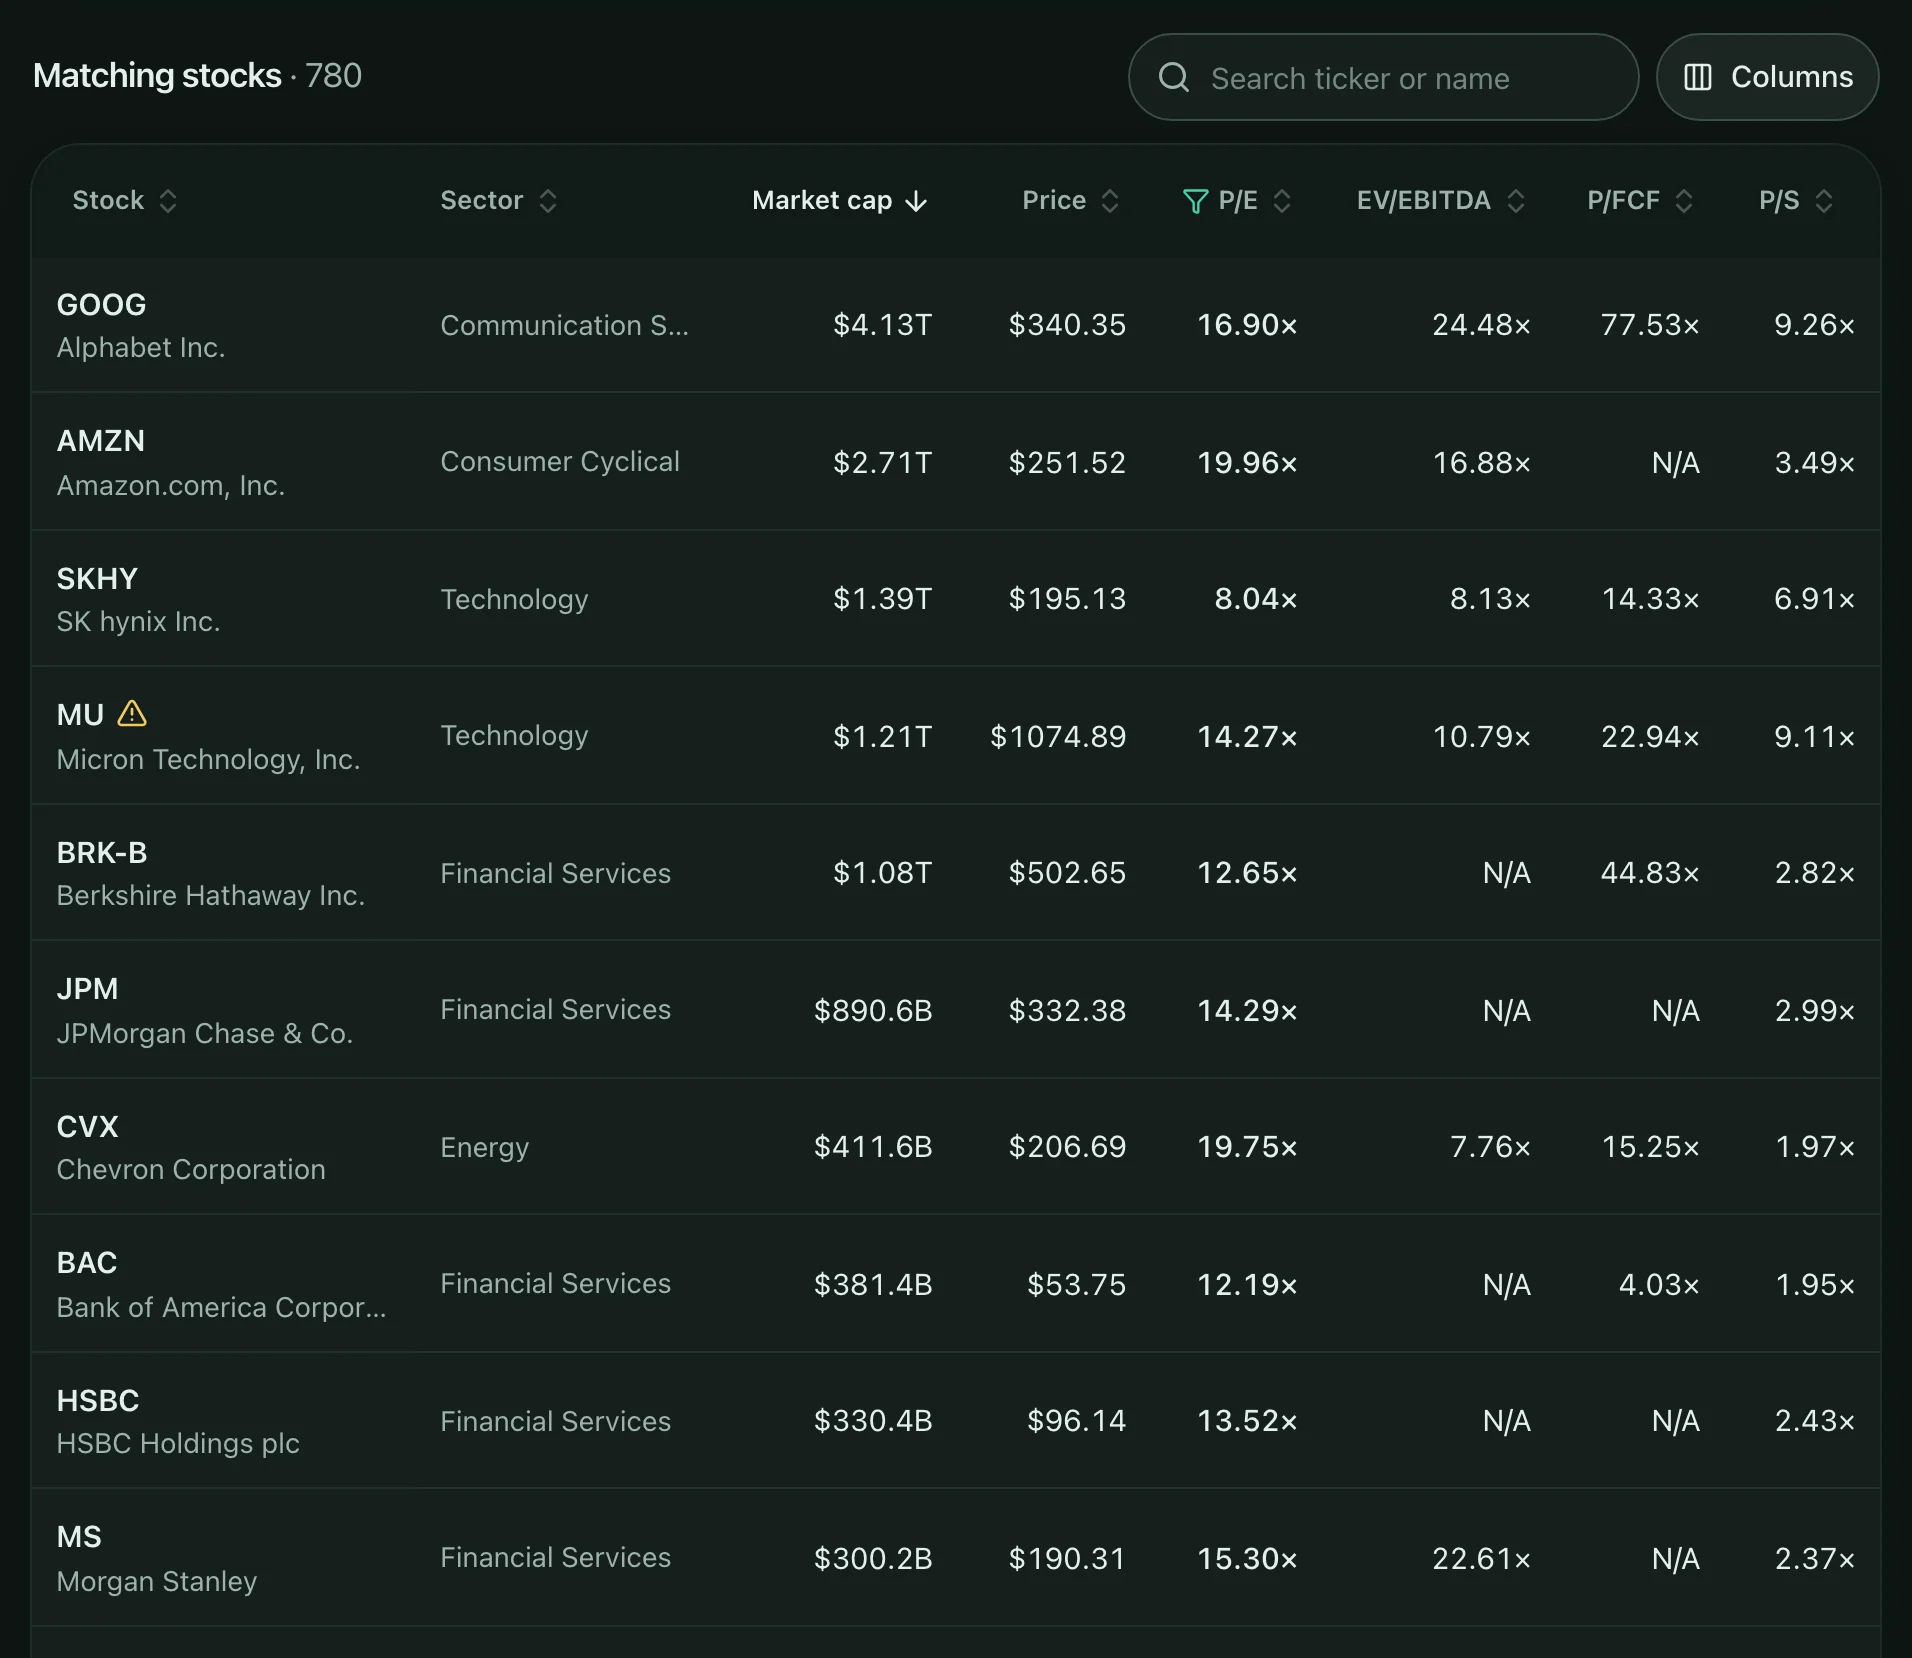
Screen only turns Stock Meadow into a classic screener. Set your filters and get every matching stock in a sortable table, largest company first. Pick the columns yourself, or let a style choose them.
Filters that read like English
Switch on “P/E below 20” or “dividend yield above 3%”. Each filter shows as a chip you can remove in one tap.
Rank within each sector
Compare banks with banks and software with software, so one cheap sector doesn't fill the whole list.
Save your screens
Keep the screens you like, rename them, and come back to them from any device.
Works on your phone
The full screener works on phones and tablets, in light or dark mode.
Like what you see? It's free while we're in preview.
Request free accessScoring models
6 ways to score a stock
Use a classic from the investing books, or build your own. Every model gives each stock a score from 0 to 100, and you can switch between them at any time.
Weighted ranking
Rank each metric 0–100, then blend with your weights
- Uses:
- The metrics and weights you choose
- Best for:
- Building your own recipe. All five styles start here.
Z-score composite
Like weighted ranking, but rewards how far ahead a stock is
- Uses:
- The metrics and weights you choose
- Best for:
- Rewarding real standouts, not stocks that only edge ahead.
Balanced (no weak link)
Favours stocks that are solid in every area you score
- Uses:
- The metrics and weights you choose
- Best for:
- Avoiding lopsided picks, such as a cheap stock of poor quality.
Magic Formula
Joel Greenblatt's good companies at good prices
- Uses:
- Earnings yield and return on invested capital
- Best for:
- A simple, rules-based value strategy from The Little Book That Beats the Market.
Piotroski F-Score
Nine pass/fail tests of financial strength
- Uses:
- Nine pass/fail tests on the last two years of accounts
- Best for:
- Checking financial strength, especially among cheap stocks.
Income (dividends)
Generous, growing and well-covered dividends
- Uses:
- Dividend yield, dividend growth, payout ratio and free-cash-flow cover
- Best for:
- Income that's generous today and likely to keep growing.
The data
What's in the data
Prices and company financials for the largest US-listed stocks, checked and refreshed every weekday.
About 2,000 US-listed companies
The largest by market value, down to roughly $2 billion, including foreign companies listed in the US.
Stocks only
Common stock, one share class per company. No ETFs, funds, preferred shares, warrants or SPACs.
Updated every weekday
New prices and financials each evening after the US market closes. Every stock shows the date of its latest price and financials.
Price history
About a year of daily prices for each stock, charted against its 50- and 200-day moving averages.
Company financials
Trailing twelve-month figures, plus annual income statements, balance sheets and cash-flow statements compared year over year.
Company details
Sector, industry, market cap, share price, dollars traded per day, 52-week range, beta, dividend per share and employees.
32 metrics in 7 groups
Score or filter on most of them. A few, such as beta and employees, describe a company rather than rate it, so they can only be filtered. The scoring guide defines each one.
Valuation
6- P/E (TTM)What you pay for each dollar of profit
- Forward PEGPrice vs. profit, adjusted for expected growth
- EV / EBITDA (TTM)Whole-company price vs. operating cash earnings
- Price / free cash flow (TTM)What you pay for each dollar of spare cash
- Price / sales (TTM)What you pay for each dollar of sales
- Earnings yield (TTM)Operating profit for each dollar of the whole company
Profitability
5- Return on equity (TTM)Profit made on shareholders' money
- Return on invested capital (TTM)Profit made on all money invested in the business
- Gross margin (TTM)Share of sales left after making the product
- Operating margin (TTM)Share of sales left after running the business
- Free cash flow margin (TTM)Share of sales that becomes spare cash
Growth
3- Revenue growth (annual)How fast sales grew last year
- Diluted EPS growth (annual)How fast profit per share grew last year
- Operating cash flow growth (annual)How fast cash from operations grew last year
Financial health
5- Net debt / EBITDAYears of earnings needed to pay off debt
- Interest coverageHow easily profits cover interest payments
- Piotroski F-ScoreHow many of nine financial-strength tests are passed
- Altman Z-ScoreBankruptcy risk; above 3 is safe, below 1.8 is distressed
- Beneish M-ScoreEarnings-quality check; above −1.78 is a warning sign
Dividends
5- Dividend yield (TTM)Yearly dividends as a share of the price
- Payout ratio (TTM)Share of profit paid out; 25–65% is sustainable
- Dividend growth (3-year)How fast the dividend per share has grown each year
- Dividend cover by free cash flowHow many times spare cash covers the dividend
- Last annual dividendDividends per share over the last year, in dollars
Price trend
7- Price vs. 200-day SMAHow far the price sits above its long-term trend
- 50-day vs. 200-day SMAWhether the recent trend beats the long-term one
- 12-month momentum (skip 1 month)Last year's return, ignoring the most recent month
- Six-month relative strengthSix-month return compared with the S&P 500
- RSI (14 day)Recent buying momentum; 50–70 is healthy
- 60-day annualized volatilityHow much the price has swung lately
- BetaHow much the stock moves with the market; 1 moves in step
Company
1- EmployeesFull-time staff, as last reported
Not included: live prices during the trading day, ETFs and funds, trading or brokerage, and buy or sell tips. Stock Meadow helps you find stocks to research; the decisions are yours.
Request access
Get a free invite
Stock Meadow is free and invite-only while we build it. Tell us who you are and Moolah will be in touch.
Already invited? Sign in
Questions