
Stock Meadow · Model backtests
Stock backtesting: see how a scoring model would have picked stocks in the past
The model backtester runs any of the 9 scoring models, or your own, on past dates: it scores the 3,000 largest US stocks of each date, holds the top-scored ones and follows the result, using only what was public at the time and including companies that were later delisted.
How the test works
A scoring model ranks stocks from 0 to 100 on the metrics you choose. The backtester asks a simple question: if this model had been used in the past, which stocks would it have ranked highest, and how would holding them have turned out? It is a simulation on past data, not a record of real trades.
- Only what was known. On each rebalance date the model sees prices up to that date and the financial statements public by then, as first reported. A statement counts from the day after it was filed with the SEC; nothing filed afterwards is used to rewrite the past.
- The stocks of that date. Each month the test ranks the 3,000 largest US-listed common stocks by market value of that month, with no size floor. Companies that were later taken over, failed or were removed from the exchange are included while they were listed, so the test is free of survivorship bias.
- 20 years of history. The history starts in January 2006. The backtest opens on 10 years; 5 years and 20 years are one click away.
- Holding and rebalancing. The top-scored stocks are held in equal parts. Between rebalances the weights drift and dividends are reinvested.
- When a company leaves. A company that failed counts as a total loss. A company that was taken over is cashed out at its last price. Under Advanced you can count every delisting one way or the other to see the range.
The settings you can change
| Setting | Choices |
|---|---|
| Model | Any of the 9 scoring models, or your own metrics, weights and filters from the stock scoring model |
| Period | 5 years, 10 years (where it opens) or 20 years |
| Rebalance | Monthly, quarterly, every 6 months or yearly, on the calendar dates that match |
| Rebalance on | The last trading day of the month, or the first trading day of the next |
| Holdings | The top 10, 20, 30 or 50 stocks, in equal parts |
| Cost per trade | A share of every trade, charged at each rebalance, with a few levels to choose from |
| Compare with | SPY (S&P 500), QQQ (Nasdaq-100), DIA (Dow Jones), IWV (total US market), IWM (small caps), MDY (mid caps), IWD (value), IWF (growth), or stocks and ETFs of your own |
Swipe sideways to see every column.
What you see
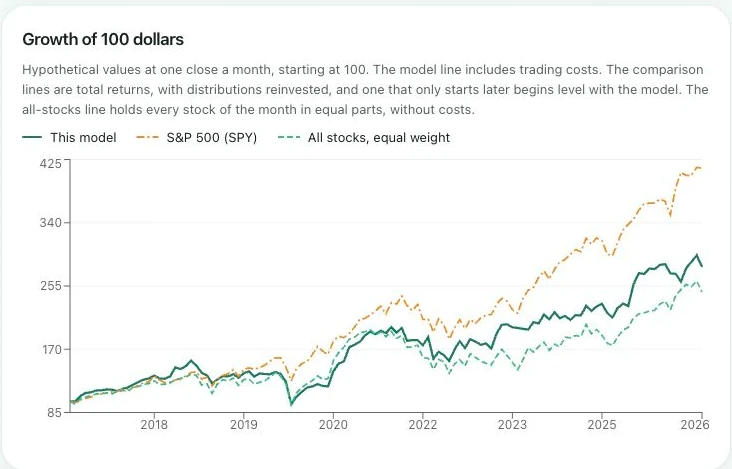
- A growth chart of the model against the comparisons you pick and against every stock of the month held in equal parts.
- Tiles for the yearly return, total return, volatility, Sharpe ratio, beta, turnover and the cost of trading.
- Deepest fall with the dates it began and bottomed out, and whether the portfolio got back to its earlier high.
- Year by year returns for the model and each comparison, with the difference between them.
- Holdings after every rebalance, with each stock's score and weight and which stocks were added or dropped.
- Delisted while held: a table of the companies that left the market while the model held them, with the date, what happened, their share of the portfolio and their effect on the result.
The backtester in a picture
What is left out, and what is rebuilt
Some metrics need information that exists only as of today. They cannot be tested on past dates, so the test leaves them out and says so above the results, naming each one and why:
- Analysts' forecasts and their changes, such as forward PEG, expected growth and estimate revisions.
- Insider and Congress trades, and institutional ownership.
- Employee counts.
A model that uses one of them is tested without it, and the remaining metrics keep their weights relative to each other. Other figures, such as P/E, EV/EBITDA, margins and return on capital, are rebuilt for each past date from the statements and prices, so they are close to, not identical with, the figures shown on the site today. The page marks which are which.
Limits to keep in mind
- Hypothetical results. The portfolio is simulated with no real money. Taxes and the gap between bid and ask prices are not included, and real trading would have differed.
- Past results don't predict future results. It is easy to tune a model until the past looks good, which says little about what comes next.
- Month-end values. The test uses one close a month, so falls inside a month are not seen.
- Today's labels. Sector and sub-sector filters use today's labels for past dates, and a list of companies picked today is ignored because it carries hindsight.
Use a backtest to see how an idea behaved, with these limits in mind, and as one input to your own research. For research only, not investment advice.
Who can use it
The model backtester is for members. Sign up free for a 7-day trial with no card, then $20 a month or $200 a year (see pricing). Build a model in the stock scoring model, press Backtest this model, and the test runs in your browser. The user guide has every detail.
Frequently asked questions
- What is a stock backtest?
- A backtest replays a rule on past data to see how it would have behaved. Here the rule is a scoring model: on each rebalance date it scores the largest US stocks of that date, holds the top-scored ones in equal parts and follows the result forward. The outcome is hypothetical and simulated, with no real money.
- What is survivorship bias, and does this test avoid it?
- Survivorship bias is testing only the companies that still exist today, which leaves out the ones that failed or were taken over and makes the past look easier than it was. The test ranks the 3,000 largest US-listed common stocks of each date, including companies that were delisted later, from the time they were listed until they left.
- Does the test use information that wasn't public yet?
- No. On each date the model sees prices up to that date and the financial statements that were public by then, as first reported. A statement counts from the day after the company filed it with the SEC, and a later restatement counts only from the day it was filed.
- Which metrics can't be tested on past dates?
- Metrics that need information which exists only as of today are left out and listed with the reason: analysts' forecasts and estimate revisions (such as forward PEG), insider and Congress trades, institutional ownership and employee counts. The metrics that remain keep their weights relative to each other.
- Do past results predict future results?
- No. Backtest results are hypothetical, depend on the settings and the historical data, and do not predict future results. For research only, not investment advice.
- Do I need an account to run a backtest?
- Yes, the backtester is for members. Signing up is free and starts a 7-day trial with no card needed; after that it is $20 a month or $200 a year. The test runs in your browser and nothing about it is saved on our servers.
Try the model backtester
Sign up free for a 7-day trial, no card needed, then press Backtest this model in the stock scoring model. Already a member? Go straight in.
Open the backtester